
Reason to trust
How Our News is Made
Strict editorial policy that focuses on accuracy, relevance, and impartiality
Ad discliamer
Morbi pretium leo et nisl aliquam mollis. Quisque arcu lorem, ultricies quis pellentesque nec, ullamcorper eu odio.
Bitcoin SV price rallied more than 20% recently and climbed towards the $200.00 resistance. BSV is currently trading with a strong bullish bias and it could even surge above $200.00 and $205.00.
- Bitcoin SV price is up more than $100.00 this month and doubled in the value against the US Dollar.
- The price is currently up more than 20% and it tagged the $200.00 resistance.
- There was a break above a major contracting triangle near $165.00 on the 4-hours chart of the BSV/USD pair (data feed from Kraken).
- It seems like the bulls are aiming an upside break above $200.00 and $205.00 in the near term.
Bitcoin SV Could Continue To Rise
This month, bitcoin SV price started a nasty uptrend from the $95.00 support base against the US Dollar. BSV gathered momentum above the $120.00 and $150.00 resistance levels.
Furthermore, it settled above the $150.00 level and the 100 simple moving average (4-hours). Later, there was a consolidation phase above the $150.00 level. Finally, the bulls were able to push the price above the $160.00 and $170.00 levels.
More importantly, there was a break above a major contracting triangle near $165.00 on the 4-hours chart of the BSV/USD pair. It opened the doors for more gains and bitcoin SV price rallied towards the $200.00 level.
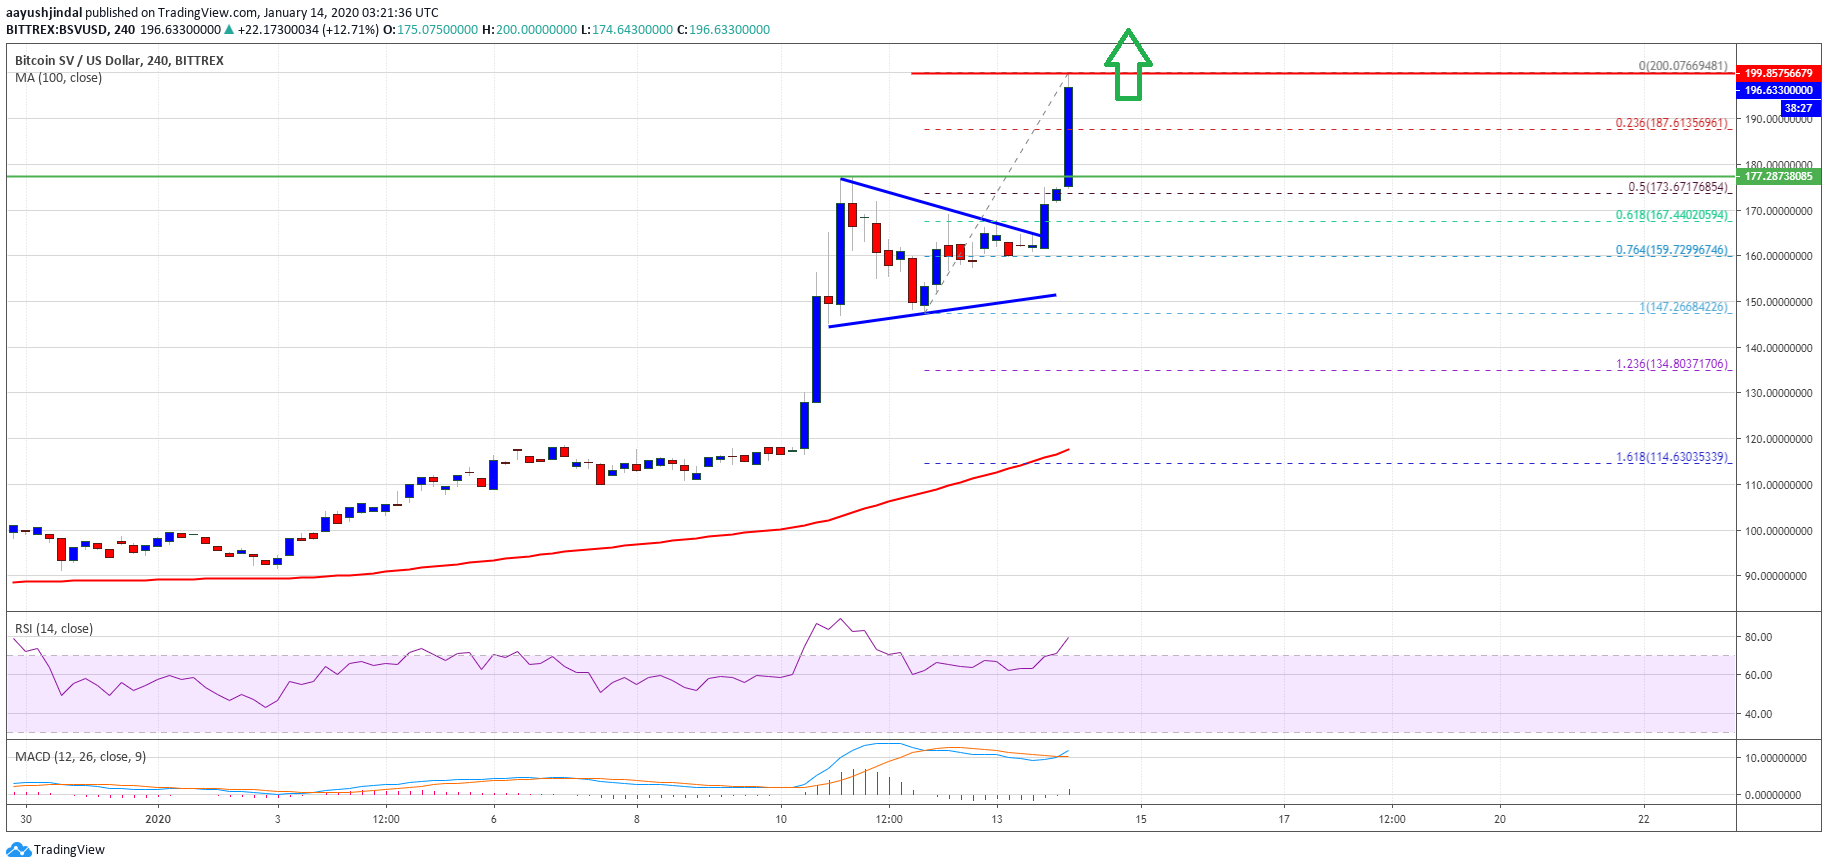
A new 2020 high is formed near $200.07 and the price is currently showing a lot of positive signs. It seems like there are high chances of more upsides above the $200.00 and $205.00 resistance levels.
The next major resistance is near the $220.00 level, above which the bulls are likely to aim a test of the $250.00 barrier in the coming days.
Downside Correction in BSV?
If there is a downside correction, an initial support is near the $188.00 level. Besides, the 23.6% Fib retracement level of the recent rally from the $147.26 low to $200.07 high is also near $188.00 level.
The main support on the downside is near the $175.00 area (the recent breakout zone). Additionally, the 50% Fib retracement level of the recent rally from the $147.26 low to $200.07 high is near $173.65.
Therefore, dips in bitcoin SV towards the $180.00 and $175.00 levels are likely to find buyers in the near term.
Technical indicators
Hourly MACD – The MACD for BSV/USD is currently gaining pace in the bullish zone.
Hourly RSI (Relative Strength Index) – The RSI for BCH/USD is now well above the 70 level and still rising.
Key Support Levels – $188.00 and $175.00.
Key Resistance Levels – $200.00 and $220.00.


