
Reason to trust
How Our News is Made
Strict editorial policy that focuses on accuracy, relevance, and impartiality
Ad discliamer
Morbi pretium leo et nisl aliquam mollis. Quisque arcu lorem, ultricies quis pellentesque nec, ullamcorper eu odio.
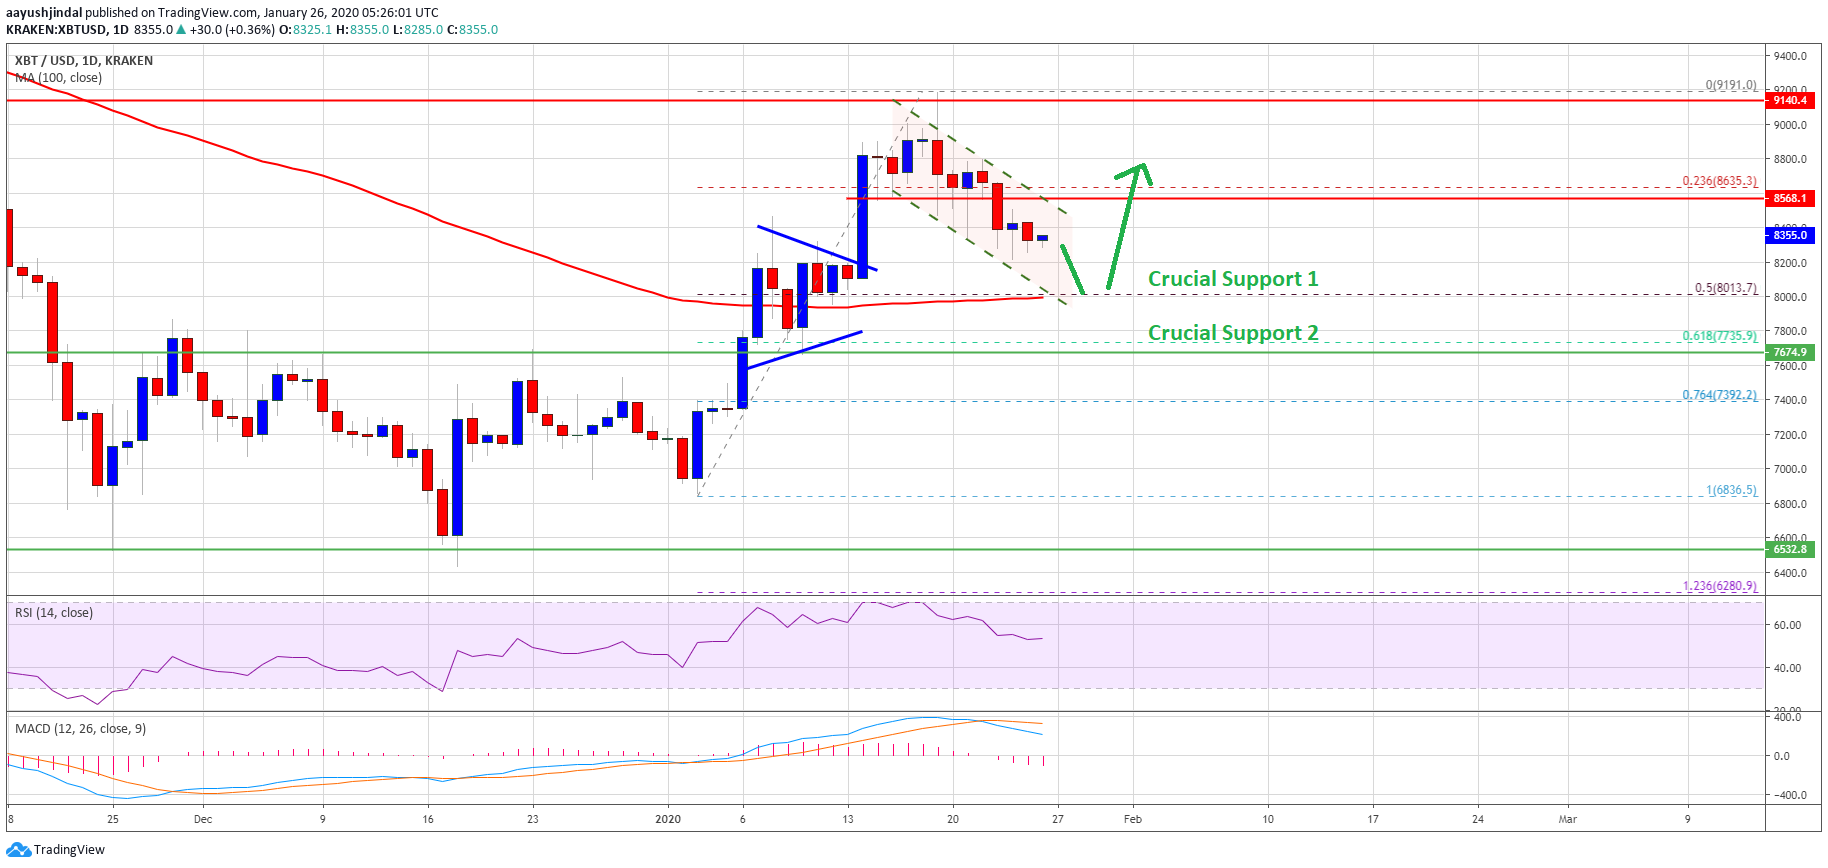
Bitcoin started a downside correction from the 2020 high at $9,191 against the US Dollar. However, BTC price is still in an uptrend and it could find buyers near $8,000 or $7,670.
- Bitcoin price started a short term downside correction below $9,000 and $8,800.
- It is currently trading above $8,200 and there are many important supports on downside.
- There is a declining channel or a bullish flag forming with resistance near $8,500 on the daily chart of the BTC/USD pair (data feed from Kraken).
- The pair is likely to find a strong buying interest near $8,000 and the 100-day simple moving average.
Bitcoin Price Remains Supported On Dips
After forming a short term top near the $9,191 level, bitcoin started a downside correction. BTC price broke the $9,000 and $8,800 levels to enter a bearish zone.
The bears were able to push the price below the 23.6% Fib retracement level of the last important rise from the $6,836 low to $9,191 high. Moreover, there was a daily close below the $8,500 support level.
Though, there are many important supports on the downside near the $8,200 and $8,000 levels. The main support is near the $8,000 level since it is close to the 100-day simple moving average.
Besides, the 50% Fib retracement level of the last important rise from the $6,836 low to $9,191 high is also near the $8,000 level. Therefore, dips remain supported on the downside if the price corrects further.
On the upside, the $8,500 zone is a major hurdle for the bulls. There is also a declining channel or bullish flag forming with resistance near $8,500 on the daily chart of the BTC/USD pair.
Therefore, bitcoin needs to climb above the $8,500 and $8,540 resistance levels to start a fresh increase. Furthermore, a successful close above $8,600 might lead the price towards $9,000 and $9,200.
Chances of Major Drop in BTC?
As stated, the $8,000 support is a major buy zone. If there is a downside break below $8,000, the next major support is near the $7,670 area.
The previous breakout zone was near $7,670 and now it coincides with the 61.8% Fib retracement level of the last important rise from the $6,836 low to $9,191 high.
Thus, a successful daily close below $7,670 or $7,600 could negate the current bullish view. In the mentioned case, the price is likely to revisit the $6,500 support area.
Technical indicators:
Daily MACD – The MACD is slowly gaining momentum in the bearish zone.
Daily RSI (Relative Strength Index) – The RSI for BTC/USD is still above the 50 level.
Major Support Levels – $8,200 followed by $8,000.
Major Resistance Levels – $8,500, $8,550 and $9,200.


