
Reason to trust
How Our News is Made
Strict editorial policy that focuses on accuracy, relevance, and impartiality
Ad discliamer
Morbi pretium leo et nisl aliquam mollis. Quisque arcu lorem, ultricies quis pellentesque nec, ullamcorper eu odio.
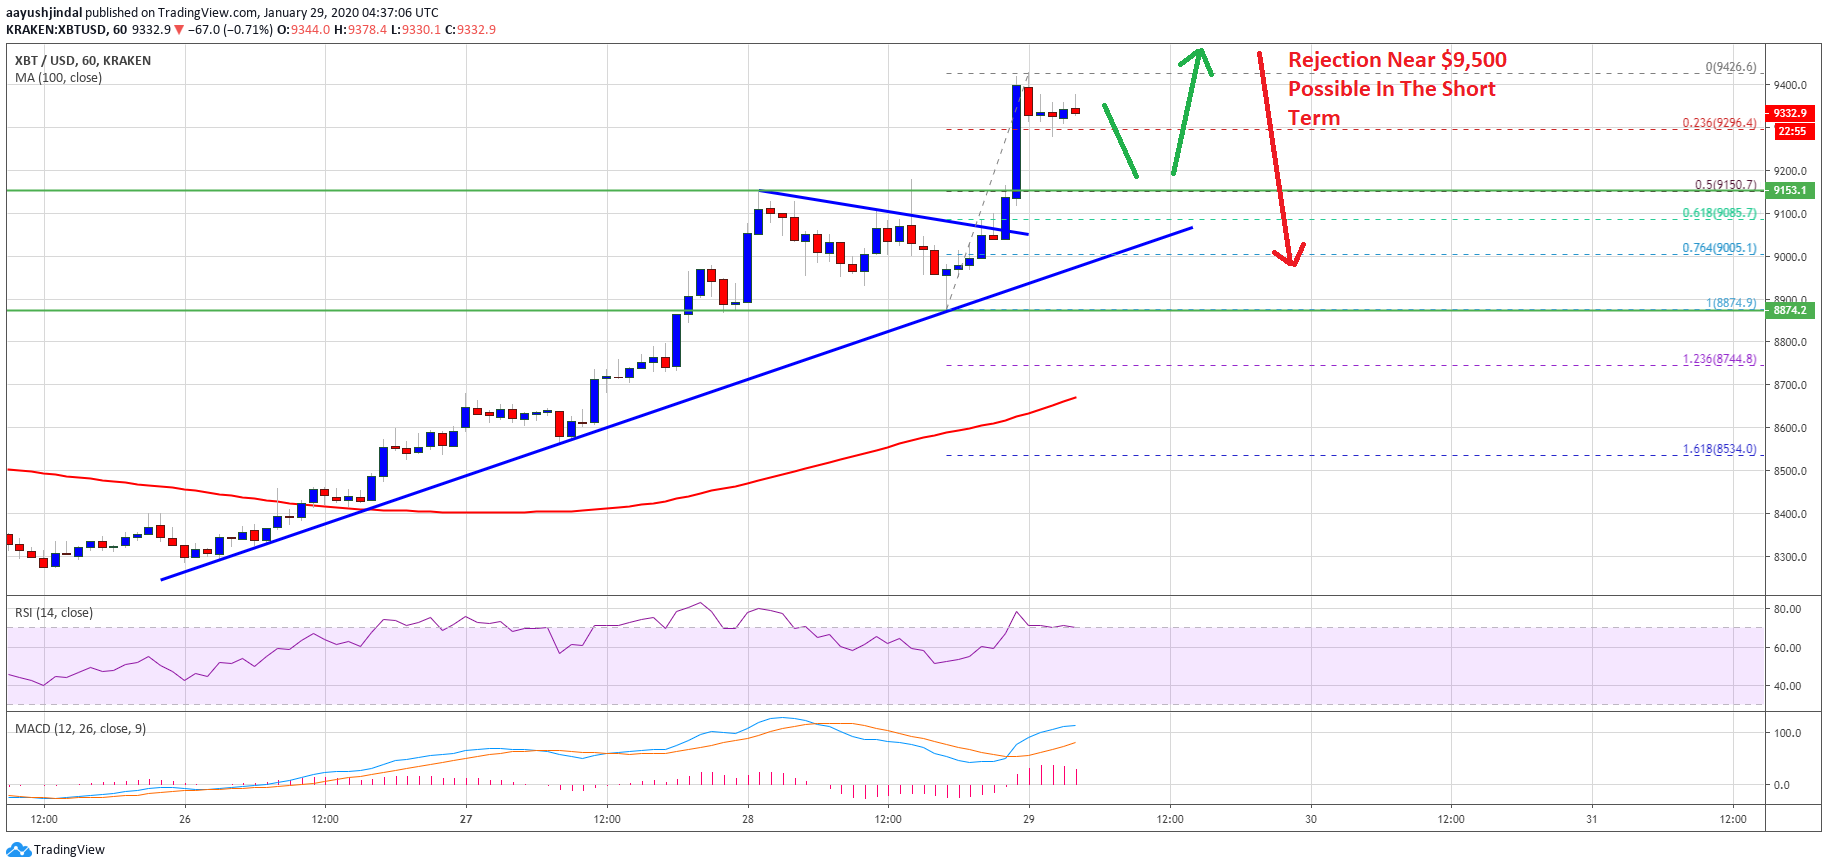
Bitcoin extended its rally above the $9,200 resistance against the US Dollar. BTC tagged the $9,400 area and now it could correct lower towards $8,800 or $8,500.
- Bitcoin price is approaching a couple of key resistances near $9,500 against the US Dollar.
- There could be a short term downside correction from $9,400 or $9,500 in the coming sessions.
- Yesterday’s major bullish trend line is still active with support near $9,040 on the hourly chart of the BTC/USD pair (data feed from Kraken).
- Ethereum is lagging, but it could rally if there is a clear break above the $180 resistance.
Bitcoin Price Approaching Key Resistance
Yesterday, we saw a strong rise in bitcoin above the $9,000 resistance. We even discussed the chances of more upsides towards $9,500, considering a successful close above the $9,000 level and the 100 hourly simple moving average.
BTC price did continue higher above the $9,200 resistance and a connecting bearish trend line on the hourly chart. Finally, the price tested the $9,400 area. A new 2020 high is formed near $9,426 and the price is currently consolidating gains.
It is testing the 23.6% Fib retracement level of the recent rally from the $8,874 low to $9,426 high. On the upside, an initial resistance is near the $9,400 level.
However, the main resistance is near the $9,500 level, where bitcoin bulls need to be very careful. If there is a strong rejection near $9,500, the price could start a substantial downside correction. The first key support on the downside is near the $9,150 level.
Besides, the 50% Fib retracement level of the recent rally from the $8,874 low to $9,426 high is near $9,150. More importantly, yesterday’s major bullish trend line is still active with support near $9,040 on the hourly chart of the BTC/USD pair.
Therefore, a downside break below $9,000 might lead bitcoin price towards the $8,800 support area or the 100 hourly simple moving average.
What If BTC Surges Above $9,500?
We cannot discard the fact that BTC bears might fail to protect $9,500. In the mentioned case, the price is likely to surge towards the $10,000 handle.
Any further upsides could open the doors for a larger upward move towards the $11,200, $11,500 and $12,000 levels in the coming days.
Technical indicators:
Hourly MACD – The MACD is slowly losing momentum in the bullish zone.
Hourly RSI (Relative Strength Index) – The RSI for BTC/USD is currently correcting from the 75 level.
Major Support Levels – $9,150 followed by $9,000.
Major Resistance Levels – $9,400, $9,425 and $9,500.


