
Reason to trust
How Our News is Made
Strict editorial policy that focuses on accuracy, relevance, and impartiality
Ad discliamer
Morbi pretium leo et nisl aliquam mollis. Quisque arcu lorem, ultricies quis pellentesque nec, ullamcorper eu odio.
Ethereum is trading below the key $235 resistance area against the US Dollar. ETH price seems to be forming a strong support above $220 and it could soon rally above $235.
- Ethereum is likely forming a bottoming pattern above the $220 level against the US Dollar.
- The price could gain bullish momentum once there is a clear break above the $235 resistance.
- There is a major bullish trend line in place with support near $225 on the hourly chart of ETH/USD (data feed via Kraken).
- Bitcoin price is trading above the $9,000 level and it may soon start another increase.
Ethereum Price Likely Forming Bottoming Pattern
In the past two days, Ethereum remained well bid above the $220 support level against the US Dollar. ETH price settled above the $225 level and the 100 hourly simple moving average.
On the upside, the $235 resistance area is acting as a strong barrier for the bulls. There were more than two attempts already to clear the $235 barrier, but the bulls struggled to gain momentum.
The recent high was near $235 and the price corrected below the $232 level. Ethereum is currently holding the $228 support level and the 100 hourly simple moving average. The 50% Fib retracement level of the upward move from the $220 low to $234 high is also acting as a decent support.
Moreover, there is a major bullish trend line in place with support near $225 on the hourly chart of ETH/USD. The trend line is close to the 61.8% Fib retracement level of the upward move from the $220 low to $234 high.
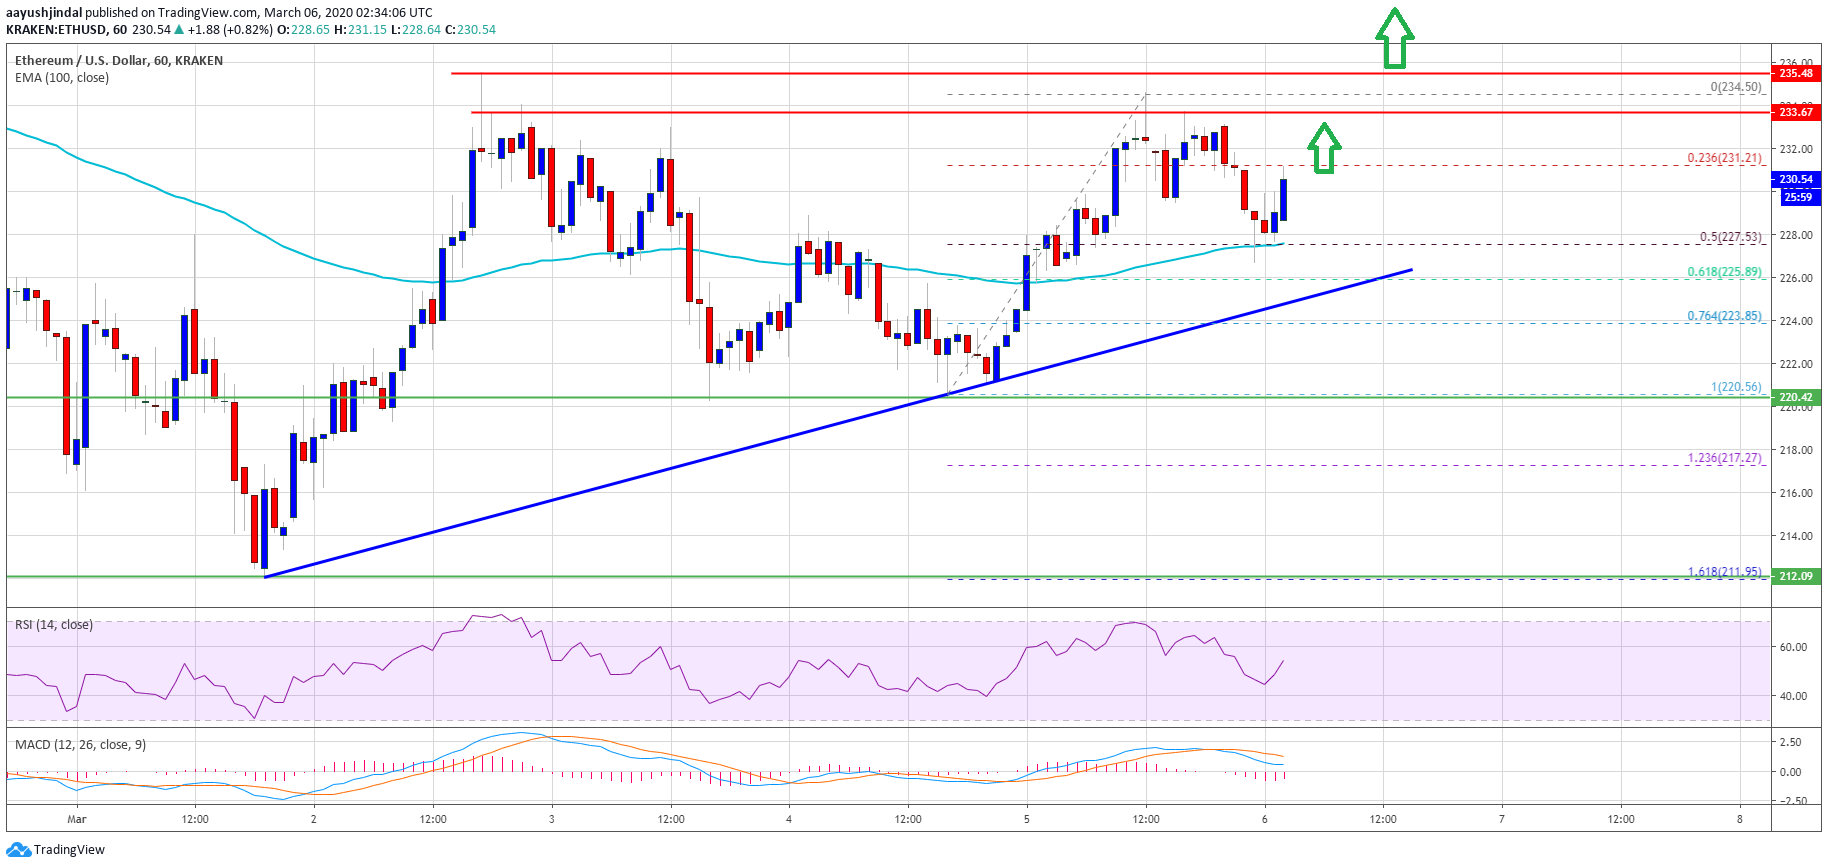
On the upside, the price is facing a strong barrier near the $235 level. A successful break above the $235 resistance area could open the doors for a larger rally. The next major resistance is near the $245 and $250 levels.
Here Are Major Buy Zones
If Ethereum struggles to clear the $235 resistance area, there is a risk of a short term downside correction. The first key support is near the 100 hourly simple moving average and the trend line support at $225.
The main range support is still near the $220 level, below which the bears are likely to aim a larger decline below the $218 and $215 levels. The next major support is near $212, where the bulls are likely to appear.
Technical Indicators
Hourly MACD – The MACD for ETH/USD is about to move back into the bullish zone.
Hourly RSI – The RSI for ETH/USD is currently rising and it is above the 50 level.
Major Support Level – $225
Major Resistance Level – $235


