
Reason to trust
How Our News is Made
Strict editorial policy that focuses on accuracy, relevance, and impartiality
Ad discliamer
Morbi pretium leo et nisl aliquam mollis. Quisque arcu lorem, ultricies quis pellentesque nec, ullamcorper eu odio.
Bitcoin is likely forming a double top pattern near the $6,000 resistance against the US Dollar. BTC price remains at a risk of a sharp decline below $5,000 if it fails to recover above $6,000.
- Bitcoin is showing a few bearish signs below the $6,000 and $6,200 resistance levels against the US Dollar.
- There is likely a double top pattern forming near the $6,000 resistance area.
- A key bearish trend line is forming with resistance near $5,650 on the hourly chart of the BTC/USD pair (data feed from Kraken).
- The pair could either decline heavily below $5,000 or it might start a decent recovery towards $6,500.
Bitcoin is Showing Bearish Signs
After a massive decline, bitcoin price recovered above $5,000 and $5,500 against the US Dollar. BTC price seems to be forming a decent support base above the $5,000 level, but it is also facing hurdles near the 100 hourly simple moving average.
It also settled above the 23.6% Fib retracement level of the main decline from the $7,988 high to $3,935 low. During the recent rise, there was a break above a connecting bearish trend line with resistance at $5,325 on the hourly chart of the BTC/USD pair.
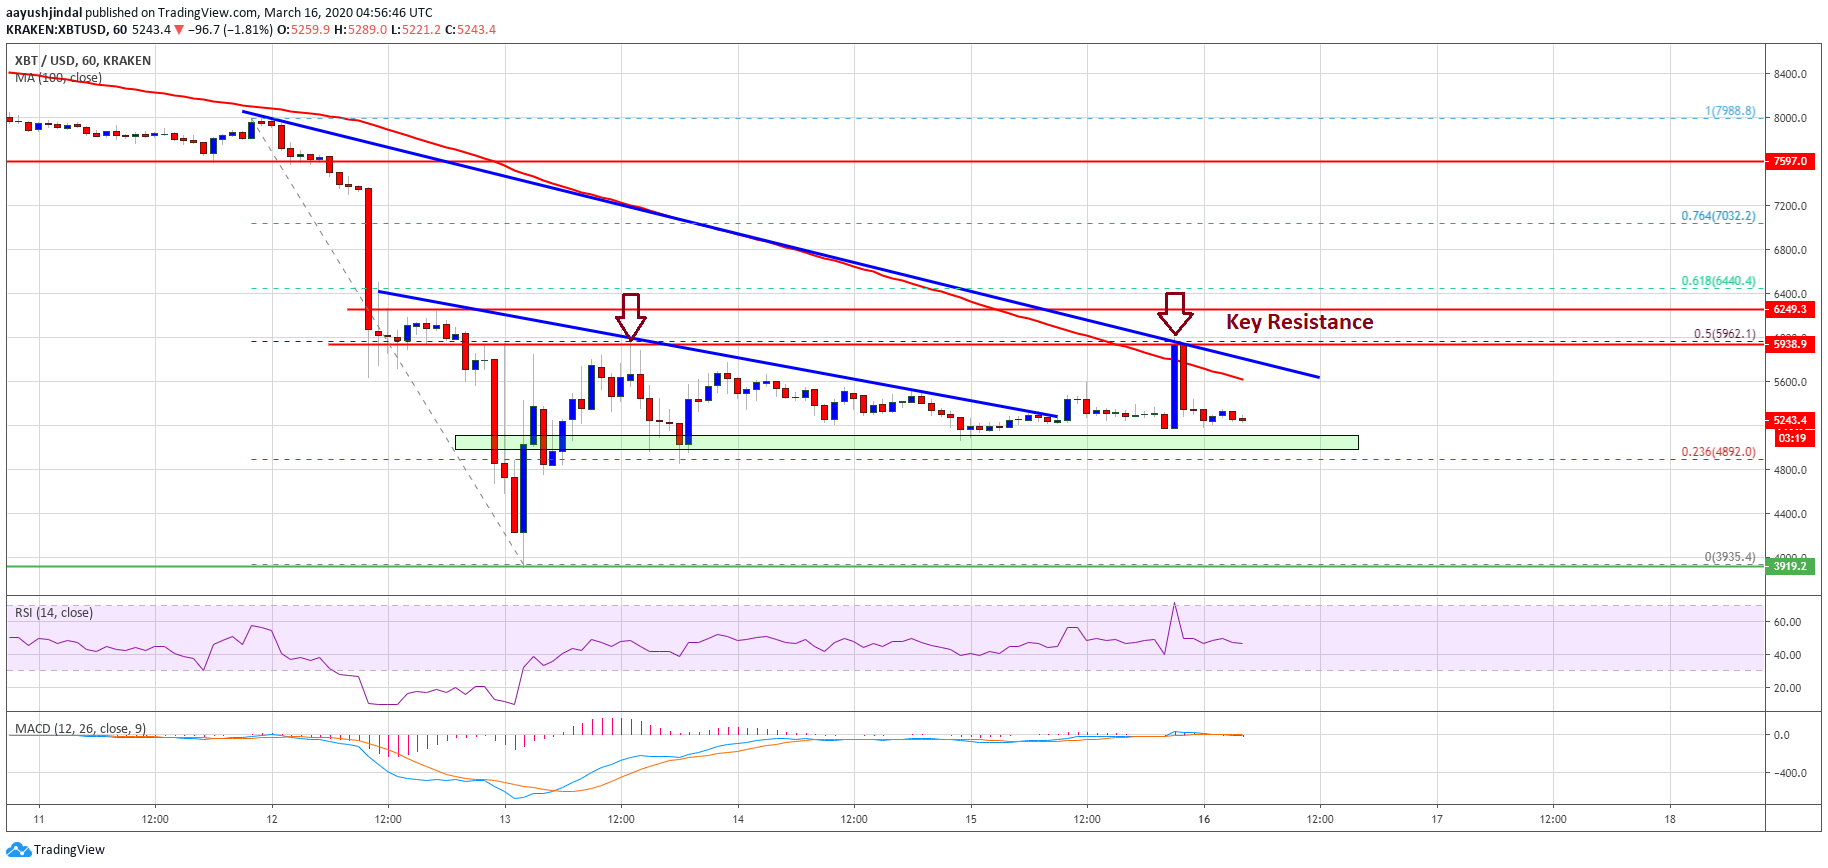
However, bitcoin price struggled to continue above the $6,000 resistance. The price made two attempts to climb above the $6,000 barrier, but it failed. The 50% Fib retracement level of the main decline from the $7,988 high to $3,935 low is also acting as a hurdle.
It seems like there is a double top pattern forming near the $6,000 resistance area. If there is a downside break below the $5,100 and $5,000 support levels, the bears are likely to take control.
The next support is near the $4,800 level, below which the price is likely to extend its decline towards the $4,400 level in the near term.
Chances of an Upside Break
If bitcoin remains well bid above the $5,000 support area, it could make another attempt to surpass $6,000. There is also a key bearish trend line is forming with resistance near $5,650 on the same chart.
A successful break above the trend line, the 100 hourly SMA, and the $6,000 barrier is must to start a strong upward move towards $6,500 in the coming sessions.
Technical indicators:
Hourly MACD – The MACD is now gaining pace in the bearish zone.
Hourly RSI (Relative Strength Index) – The RSI for BTC/USD is currently flat below the 50 level.
Major Support Levels – $5,100 followed by $5,000.
Major Resistance Levels – $5,650, $5,800 and $6,000.


