
Reason to trust
How Our News is Made
Strict editorial policy that focuses on accuracy, relevance, and impartiality
Ad discliamer
Morbi pretium leo et nisl aliquam mollis. Quisque arcu lorem, ultricies quis pellentesque nec, ullamcorper eu odio.
Ripple is showing a few positive signs above the $0.1550 resistance against the US Dollar. XRP price is likely to surge further if it clears the $0.1620 resistance area.
- Ripple price is up more than 6% and it traded above the key $0.1550 resistance against the US dollar.
- The bulls are now fighting to clear the $0.1620 and $0.1625 resistance levels.
- There was a break above a major bearish trend line with resistance near $0.1520 on the hourly chart of the XRP/USD pair (data source from Kraken).
- The price is likely to continue higher if it breaks the $0.1620 resistance area in the near term.
Ripple Price is Gaining Bullish Momentum
After forming a support base near the $0.1450 area, ripple started a fresh increase. XRP price is up more than 6% and it broke the $0.1500 and $0.1550 resistance levels.
The upward move was strong as the price even surged above the $0.1580 resistance and the 100 hourly simple moving average. There was a break above the 76.4% Fib retracement level of the key drop from the $0.1620 high to $0.1444 low.
More importantly, there was a break above a major bearish trend line with resistance near $0.1520 on the hourly chart of the XRP/USD pair. Ripple is now trading near the last pivot zone at $0.1620.
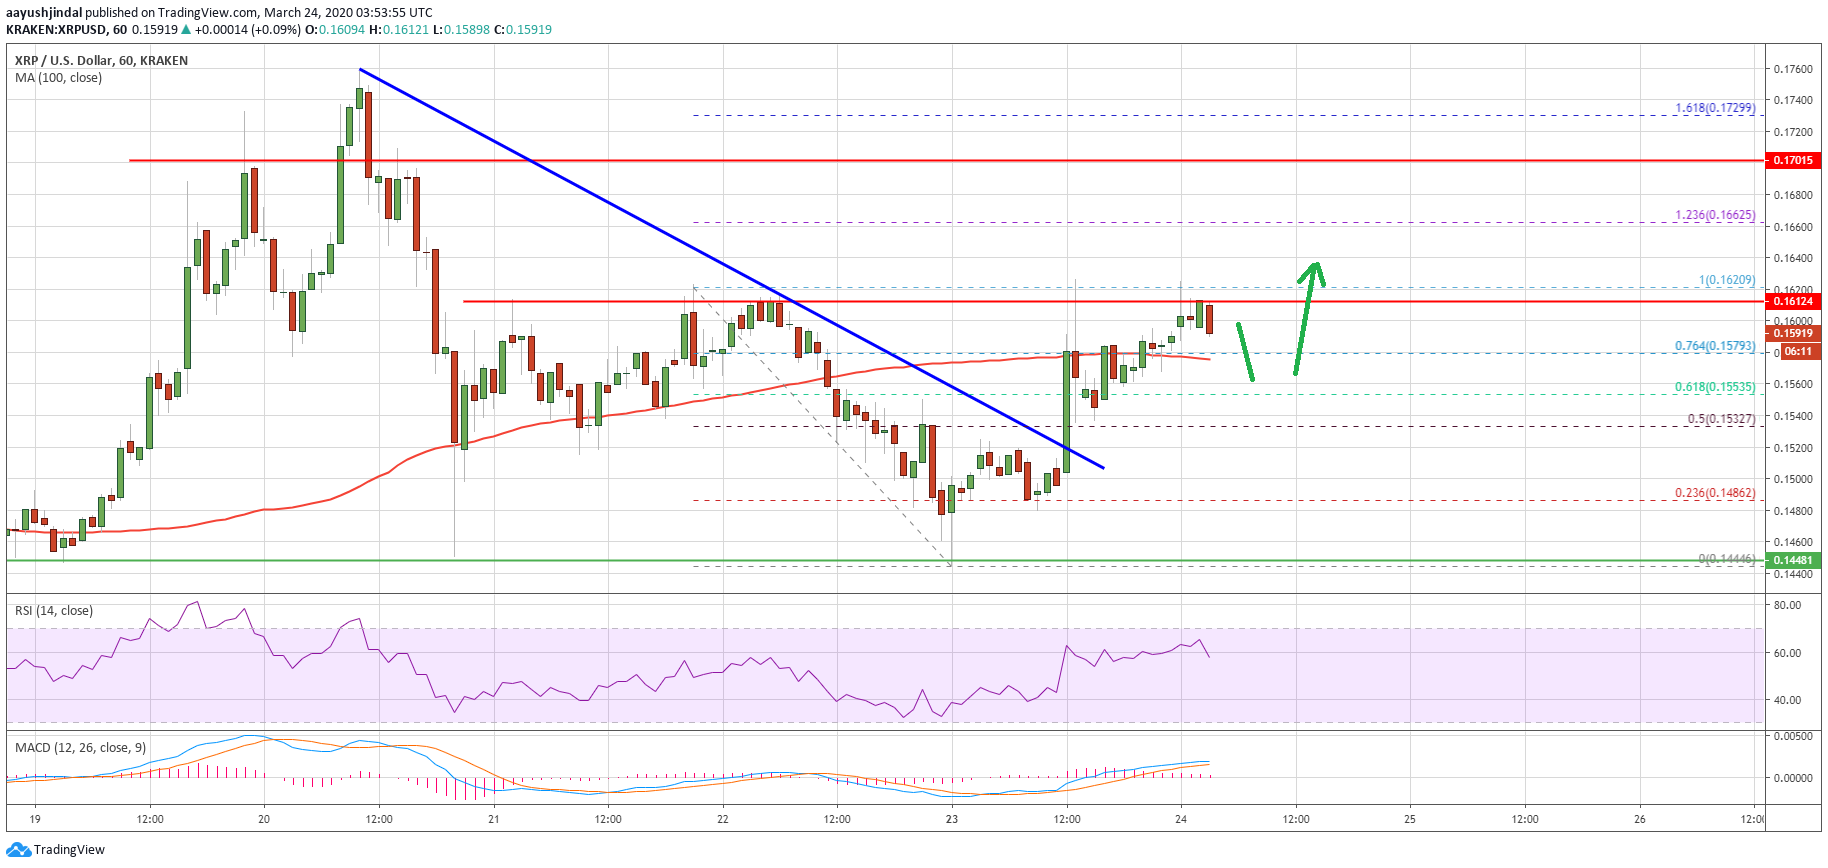
If the bulls gain pace above the $0.1620 resistance zone, it could continue to rise in the near term. An immediate resistance is near the $0.1662 level. It coincides with the 1.236 Fib extension level of the key drop from the $0.1620 high to $0.1444 low.
Any further gains is likely to lead the price towards the $0.1700 resistance area in the coming sessions. The next major hurdle is seen near the $0.1720 level.
Another Rejection?
If ripple fails to continue above the $0.1620 resistance, it could start a fresh decline. An initial support is near the $0.1575 level and the 100 hourly simple moving average.
If the bulls fail to keep the price above the 100 hourly SMA, there is a risk of more losses below the $0.1550 support level. The next key support is near the $0.1520 level, below which it could revisit $0.1500.
Technical Indicators
Hourly MACD – The MACD for XRP/USD is slowly losing momentum in the bullish zone.
Hourly RSI (Relative Strength Index) – The RSI for XRP/USD is currently correcting lower from the 65 level.
Major Support Levels – $0.1575, $0.1520 and $0.1500.
Major Resistance Levels – $0.1620, $0.1660 and $0.1700.


