
Reason to trust
How Our News is Made
Strict editorial policy that focuses on accuracy, relevance, and impartiality
Ad discliamer
Morbi pretium leo et nisl aliquam mollis. Quisque arcu lorem, ultricies quis pellentesque nec, ullamcorper eu odio.
Bitcoin failed to surpass the $7,000 resistance and declined below $6,500 against the US Dollar. BTC is likely to bounce back as long as it is above $6,000 and the 100 SMA (H4).
- Bitcoin price is currently correcting gains from the $7,000 resistance area.
- The $6,000 region and the 100 simple moving average (4-hours) are important supports.
- There was a break below a major bullish trend line with support at $6,620 on the 4-hours chart of the BTC/USD pair (data feed from Kraken).
- The pair is currently consolidating losses above the $6,000 and $6,100 levels.
Bitcoin is Approaching Crucial Support
This past week, bitcoin struggled to gain strength above the $6,880 and $7,000 resistance levels against the US Dollar. BTC price topped near the $6,982 level and recently started a fresh decline.
There was a break below the main $6,500 support area to start a substantial decline. Moreover, there was a break below a major bullish trend line with support at $6,620 on the 4-hours chart of the BTC/USD pair.
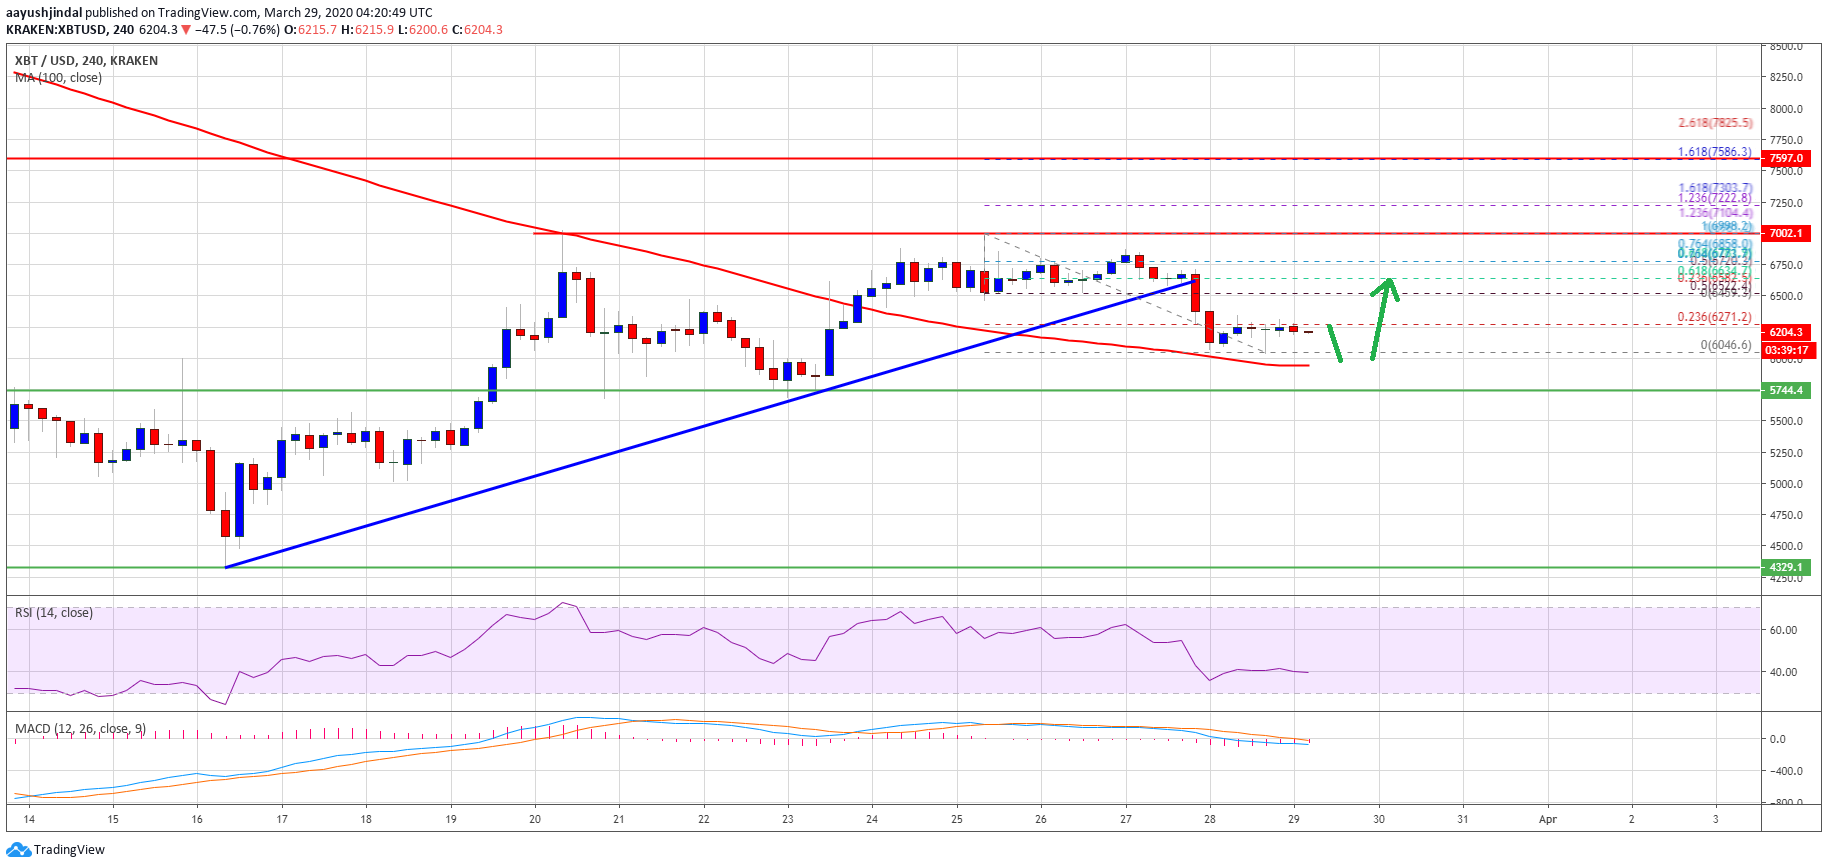
The pair even declined below the $6,200 support and traded close to the $6,000 area. A new weekly low is formed near the $6,048 level and the price is currently consolidating losses. An initial resistance on the upside is near the $6,270 level since it is close to the 23.6% Fib retracement level of the recent decline from the $6,982 swing high to $6,048 low.
On the downside, there are a couple of important supports near $6,050 and $6,000. The main support for bitcoin is near the $5,950 level and the 100 simple moving average (4-hours).
If BTC fails to stay above the 100 SMA, there is a risk of a larger decline below $5,800. An immediate support is near $5,750, below which the price is likely to decline towards the $5,500 level.
Fresh Increase
The main support for bitcoin is forming near the $6,000 area and the 100 SMA. If the price stays above the 100 SMA, there are chances of a strong recovery wave above the $6,300 level.
The next resistance is near the $6,500 region (the recent breakdown support). The 50% Fib retracement level of the recent decline from the $6,982 swing high to $6,048 low is also near $6,515.
Therefore, a successful break above the $6,500 resistance area could start a fresh increase towards the $6,800 and $7,000 resistance levels.
Technical indicators
4 hours MACD – The MACD for BTC/USD is about to move back into the bullish zone.
4 hours RSI (Relative Strength Index) – The RSI for BTC/USD is currently flat near the 40 level.
Major Support Level – $6,000
Major Resistance Level – $6,500
Take advantage of the trading opportunities with Plus500
Risk disclaimer: 76.4% of retail CFD accounts lose money.


