Reason to trust
How Our News is Made
Strict editorial policy that focuses on accuracy, relevance, and impartiality
Ad discliamer
Morbi pretium leo et nisl aliquam mollis. Quisque arcu lorem, ultricies quis pellentesque nec, ullamcorper eu odio.
Ethereum failed to surpass the $250 resistance and declined sharply against the US Dollar. ETH price could continue to move down as long as it is below $240 and the 100 hourly simple moving average.
- Ethereum started a major decline after it failed to clear the main $1250 resistance zone.
- The price declined sharply below the key $240 support and the 100 hourly simple moving average.
- There was a break below a crucial bullish trend line with support at $244 on the hourly chart of ETH/USD (data feed via Kraken).
- The pair traded as low as $225 and it is currently correcting higher above $230.
Ethereum Price Correcting Losses
Yesterday, we saw many rejections for Ethereum price near the $250 resistance area. ETH started a strong increase below the $245 and $240 support levels.
The price even settled below the $240 support and the 100 hourly simple moving average. Moreover, there was a break below a crucial bullish trend line with support at $244 on the hourly chart of ETH/USD.
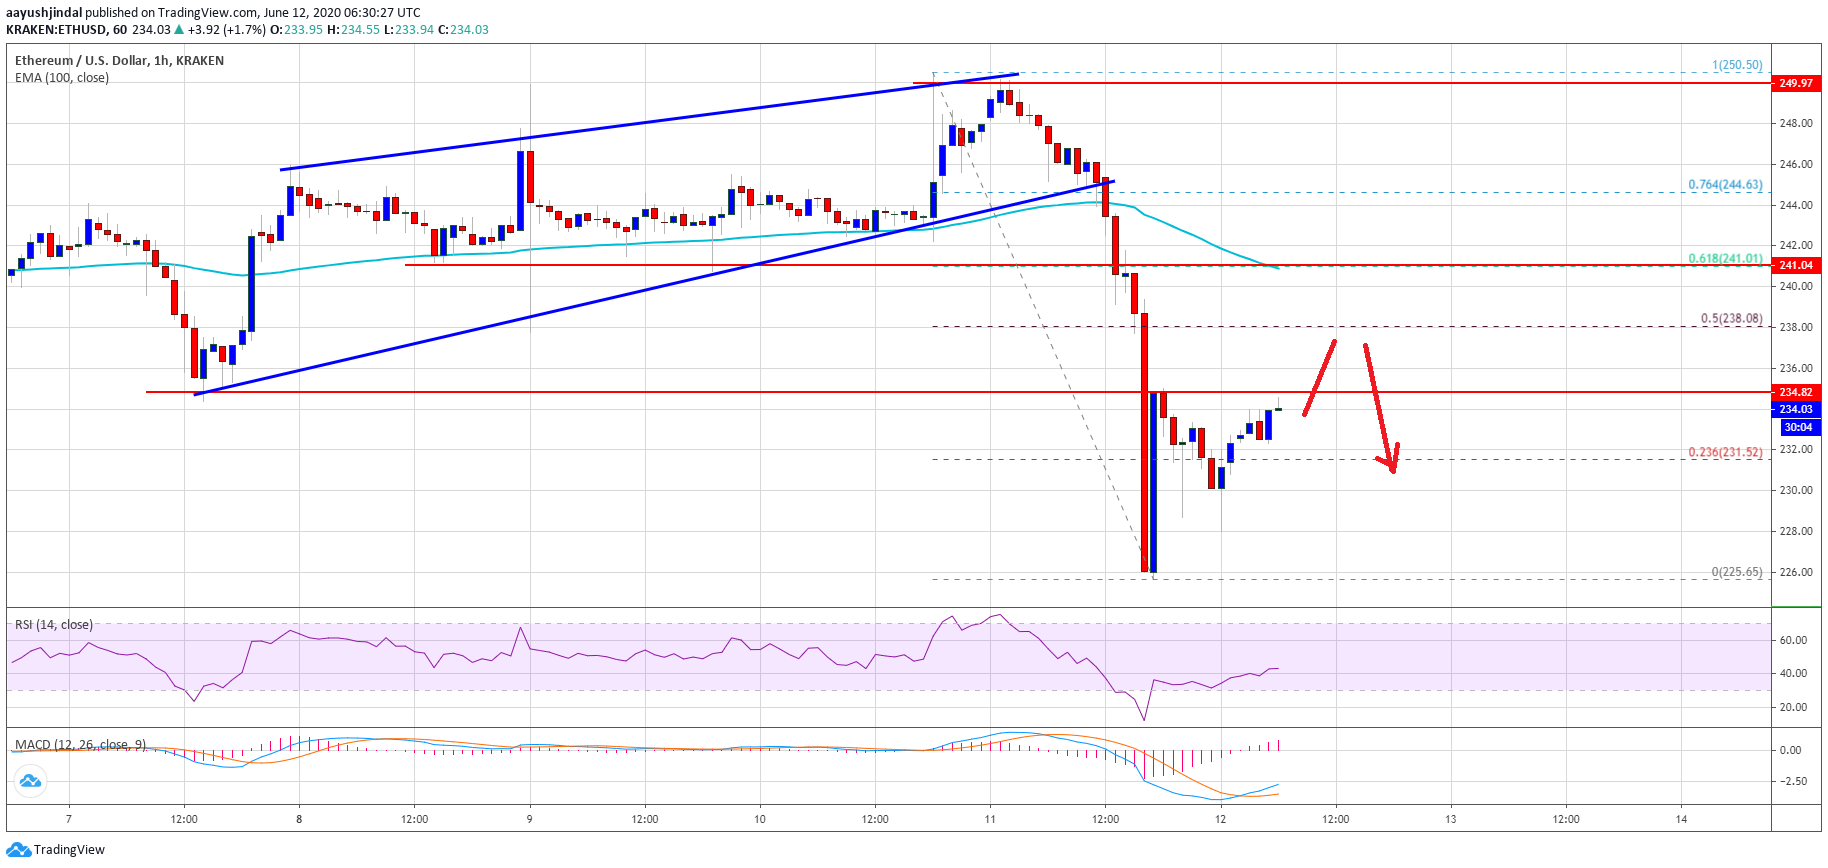
It opened the doors for more losses below the $230 level and the price traded to a new weekly low at $225. Ether is currently correcting higher and trading above the $230 level.
There was a break above the 23.6% Fib retracement level of the recent decline from the $250 swing high to $225 low. The price is now approaching the $235 resistance, which is likely to act as a hurdle.
The main resistance on the upside is forming near the $240 level or the 100 hourly SMA. An intermediate resistance is near the $238 level or the 50% Fib retracement level of the recent decline from the $250 swing high to $225 low. To move into a positive zone, the price must settle above the $235 and $240 resistance levels.
More Losses in ETH?
Once the current wave is complete in Ethereum near $235 or $240, it is likely to resume its decline in the near term. An initial support is seen near the $225 level.
The first major support is near the $220 level, below which ether price is likely to accelerate lower towards the $205 and $200 support levels in the near term.
Technical Indicators
Hourly MACD – The MACD for ETH/USD is slowly gaining pace in the bullish zone.
Hourly RSI – The RSI for ETH/USD is currently correcting higher towards the 50 level.
Major Support Level – $225
Major Resistance Level – $240
Take advantage of the trading opportunities with Plus500
Risk disclaimer: 76.4% of retail CFD accounts lose money.