

- Bitcoin price can break above $10,000 even as it eyes a choppy price action in the weeks ahead.
- The upside bias takes its cues from the crypto’s on-chain data, including higher buying strength, declining capitulation sentiment, and rising transactional volume.
- Phi Deltalytics, an independent cryptocurrency analysis portal, sees Bitcoin hitting $11,700 in the coming sessions.
Bitcoin market’s short-term bias has flipped bearish following its extended downside correction from $10,500 to nearly $9,000 in June 2020. Observers anticipate the cryptocurrency to continue its decline towards $8,600, with some even suggesting a retest of $6,000.
But analysts at Phi Deltalytics think otherwise. The independent cryptocurrency analysis portal, which accurately predicted a strong Bitcoin price move towards $10,000 in September 2019, wrote on Monday that it sees BTC/USD hit $11,700 in the coming sessions.
Strong Bitcoin On-Chain Data
Phi Deltalytics’ analogy took cues from Bitcoin’s on-chain metrics – data that represents activities taking place atop the cryptocurrency’s blockchain. Phi Deltalytics summed up its bullish prediction based on three different data points: the Relative Strength Index, Hash Ribbons, and Transactional Volume.
The Relative Strength Index, or RSI, measures an asset’s overbought or oversold conditions based on its recent price changes. Meanwhile, Hash Ribbons shows the buying/selling sentiment among miners, the entities that run the Bitcoin blockchain in return for bitcoin token rewards.
Transactional Volume measures Bitcoin’s average on-chain volume data alongside metrics that point to whale involvement. The chart below shows these three indicators.
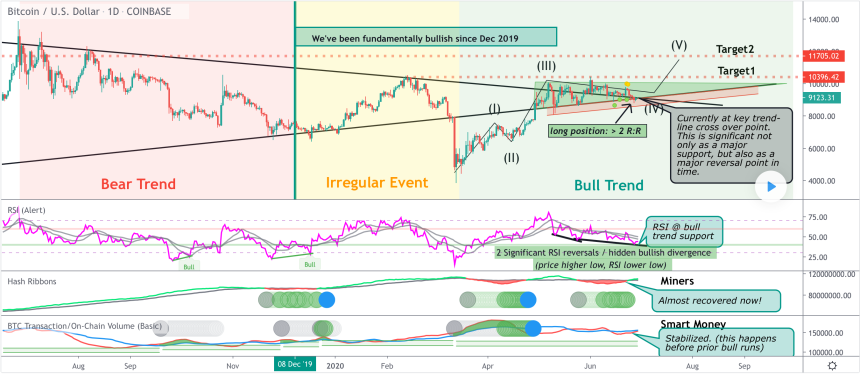

Bitcoin price chart on TradingView.com showing its on-chain indicators. Source: Phi Deltalytics, TradingView.com
An analyst associated with Phi Deltalytics noted that each of the on-chain indicators envisioned Bitcoin at a near year-to-date high. Readings on the RSI stood neutral, while Hash Ribbons data flashed green, signaling a steep decline in capitulation sentiment among miners.
Meanwhile, the BTC Transactions reflected a stabilized sentiment. The analyst noted that it happens before every big price move to the upside. Excerpts from his note to traders:
“We believe the bear trend ended in December 2019. And if COVID didn’t happen, the bull trend starting point would have been the 7k range last year. Miner capitulation and on-chain volume cycles are two of the most accurate fundamental cycle measurements, and these show strong bullish signs since 7k.”
More Optimistic Indicators
As on-chain data confirm a bull trend, a few indicators outside the realm of Bitcoin’s blockchain are also hinting a similar market outlook.
At first, data on BitFinex crypto exchange’s order-book shows that buyers are waiting to enter the market on Bitcoin’s next dip towards $8,600. The move, should it happen, would help Bitcoin sustain its overall upside trend for the year. BTC/USD is trading about 40 percent higher on a YTD timeframe.
Optimistic news also came from Wall Street. According to independent reports, New York-based Grayscale Investment Trust has accumulated 9,879 BTC for their investment product in just a week. That is more than the number of BTC produced.
“Grayscale added 19,879 BTC to their Bitcoin Trust since last week (53,588 BTC since the halving). Bitcoin miners only produced 7,081 BTC since last week (39,544 BTC since halving),” confirmed market analyst Kevin Rooke.
The move points to a rising accumulation behavior by institutional investors.