
Reason to trust
How Our News is Made
Strict editorial policy that focuses on accuracy, relevance, and impartiality
Ad discliamer
Morbi pretium leo et nisl aliquam mollis. Quisque arcu lorem, ultricies quis pellentesque nec, ullamcorper eu odio.
Bitcoin is struggling to clear the main $9,200 resistance area against the US Dollar. BTC is likely to start a strong rally if it clears the $9,200 resistance and the 100 SMA (H4).
- Bitcoin is facing a strong resistance near the $9,200 level and the 100 simple moving average (4-hours).
- The price could start a strong rally if it settles above the $9,200 barrier.
- There is a significant breakout pattern forming with resistance near $9,200 on the 4-hours chart of the BTC/USD pair (data feed from Kraken).
- The pair must stay above the $9,000 support level to avoid a major bearish break in the near term.
Bitcoin is Testing Crucial Resistance
This past week, bitcoin extended its decline below the $9,200 support level against the US Dollar. BTC even spiked below the $9,050 level and settled below the 100 simple moving average (4-hours).
A low was formed near $9,022 and recently the price started an upside correction. It surpassed the $9,100 and $9,120 levels. There was a break above the 23.6% Fib retracement level of the recent decline from the $9,358 high to $9,022 low.
However, the price is now facing a strong resistance near the $9,200 level and the 100 simple moving average (4-hours). There is also a significant breakout pattern forming with resistance near $9,200 on the 4-hours chart of the BTC/USD pair.
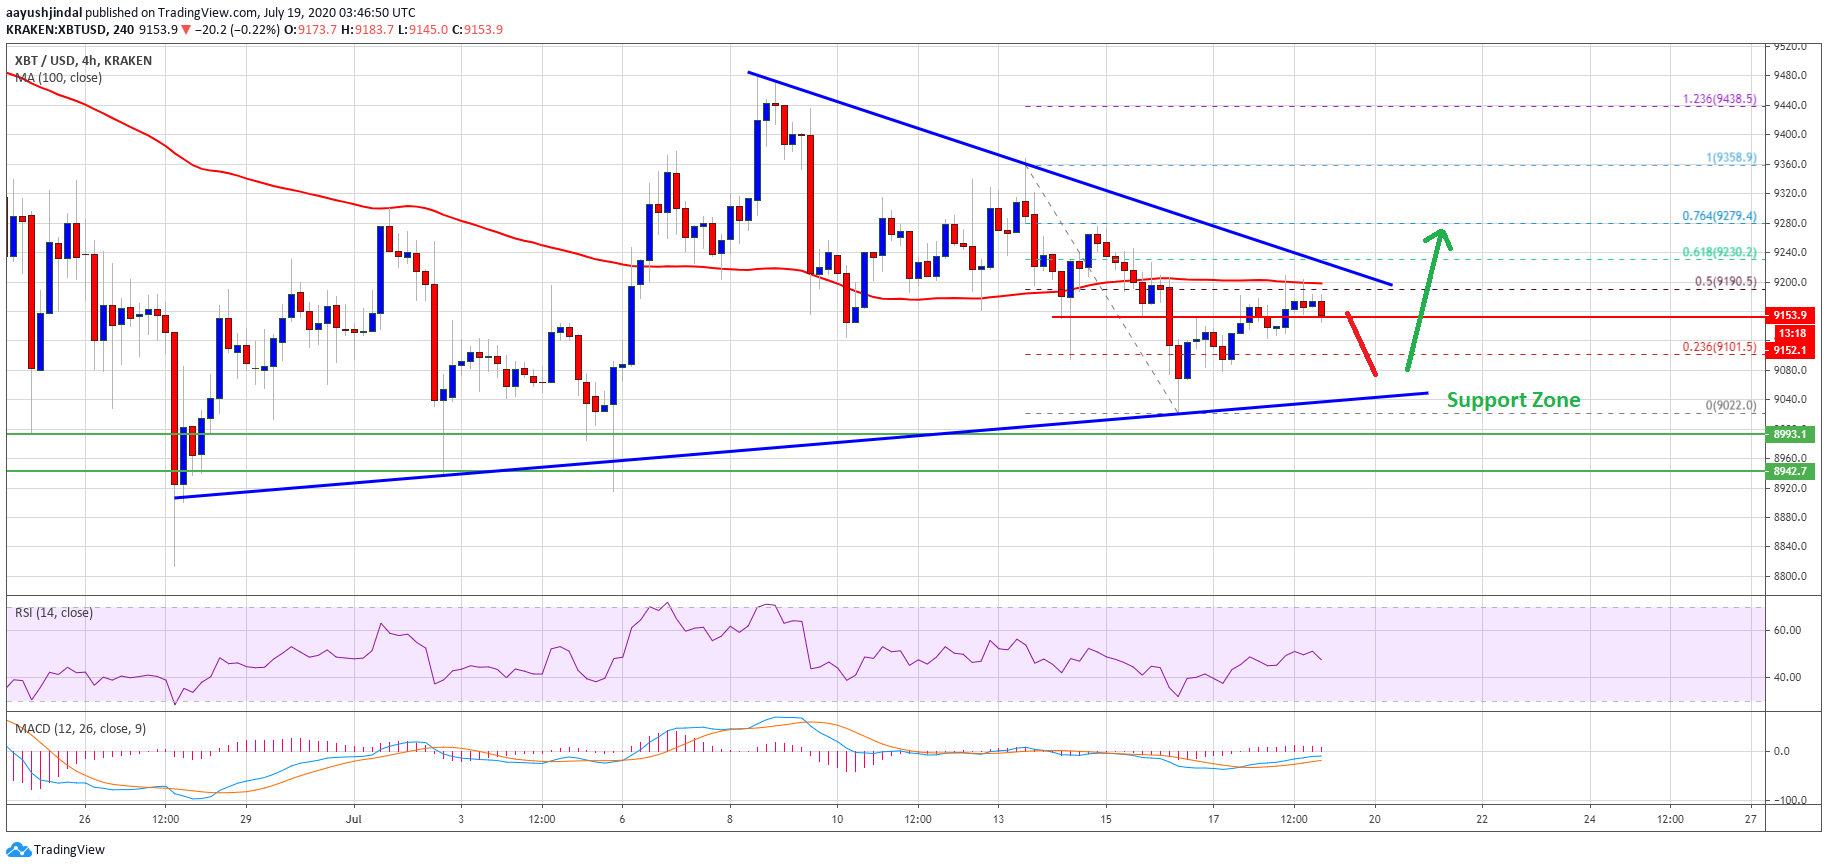
Bitcoin price trades below $9,200: Source: TradingView.com
The triangle resistance is close to the 50% Fib retracement level of the recent decline from the $9,358 high to $9,022 low. A clear break above the $9,200 level and the 100 simple moving average (4-hours) is needed to start a strong rally in the coming days.
The next major resistance above the $9,200 level is near the $9,300 level. Any further gains is likely to start a steady uptrend towards the $9,500 and $9,550 levels.
Downside Break in BTC?
If bitcoin fails to clear the $9,200 barrier and the 100 SMA, there is a risk of more losses. On the downside, the triangle support is near the $9,040 level.
The main support zone is near the $8,950 and $9,000 levels, below which there are high chances of a sharp decline towards the $8,650 and $8,500 levels.
Technical indicators
4 hours MACD – The MACD for BTC/USD is slowly losing momentum in the bullish zone.
4 hours RSI (Relative Strength Index) – The RSI for BTC/USD is currently struggling to clear the 50 level.
Major Support Level – $9,000
Major Resistance Level – $9,200
Take advantage of the trading opportunities with Plus500
Risk disclaimer: 76.4% of retail CFD accounts lose money.


