
Reason to trust
How Our News is Made
Strict editorial policy that focuses on accuracy, relevance, and impartiality
Ad discliamer
Morbi pretium leo et nisl aliquam mollis. Quisque arcu lorem, ultricies quis pellentesque nec, ullamcorper eu odio.
Bitcoin extended its rise above the $9,600 resistance level against the US Dollar. BTC is currently correcting gains, but it is likely to continue higher as long as it is above $9,500.
- Bitcoin traded further higher above $9,600 and formed a new weekly high at $9,676.
- The price is currently correcting lower below $9,600, but it is well above the 100 hourly simple moving average.
- There is a crucial bullish trend line forming with support near $9,510 on the hourly chart of the BTC/USD pair (data feed from Kraken).
- The pair could is likely to resume its upside as long as it is above $9,500.
Bitcoin Price Settles Above $9,500
After a successful break above $9,500, bitcoin extended its rally above the $9,600 level against the US Dollar. BTC even broke the $9,650 level and settled well above the 100 hourly simple moving average.
It traded to a new monthly high at $9,676 and it is currently correcting lower. There was a break below the $9,600 level, plus the 23.6% Fib retracement level of the recent upward move from the $9,465 swing low to $9,676 high.
The price is now approaching the $9,550 support zone (the recent breakout area). It is close to the 50% Fib retracement level of the recent upward move from the $9,465 swing low to $9,676 high. More importantly, there is a crucial bullish trend line forming with support near $9,510 on the hourly chart of the BTC/USD pair.
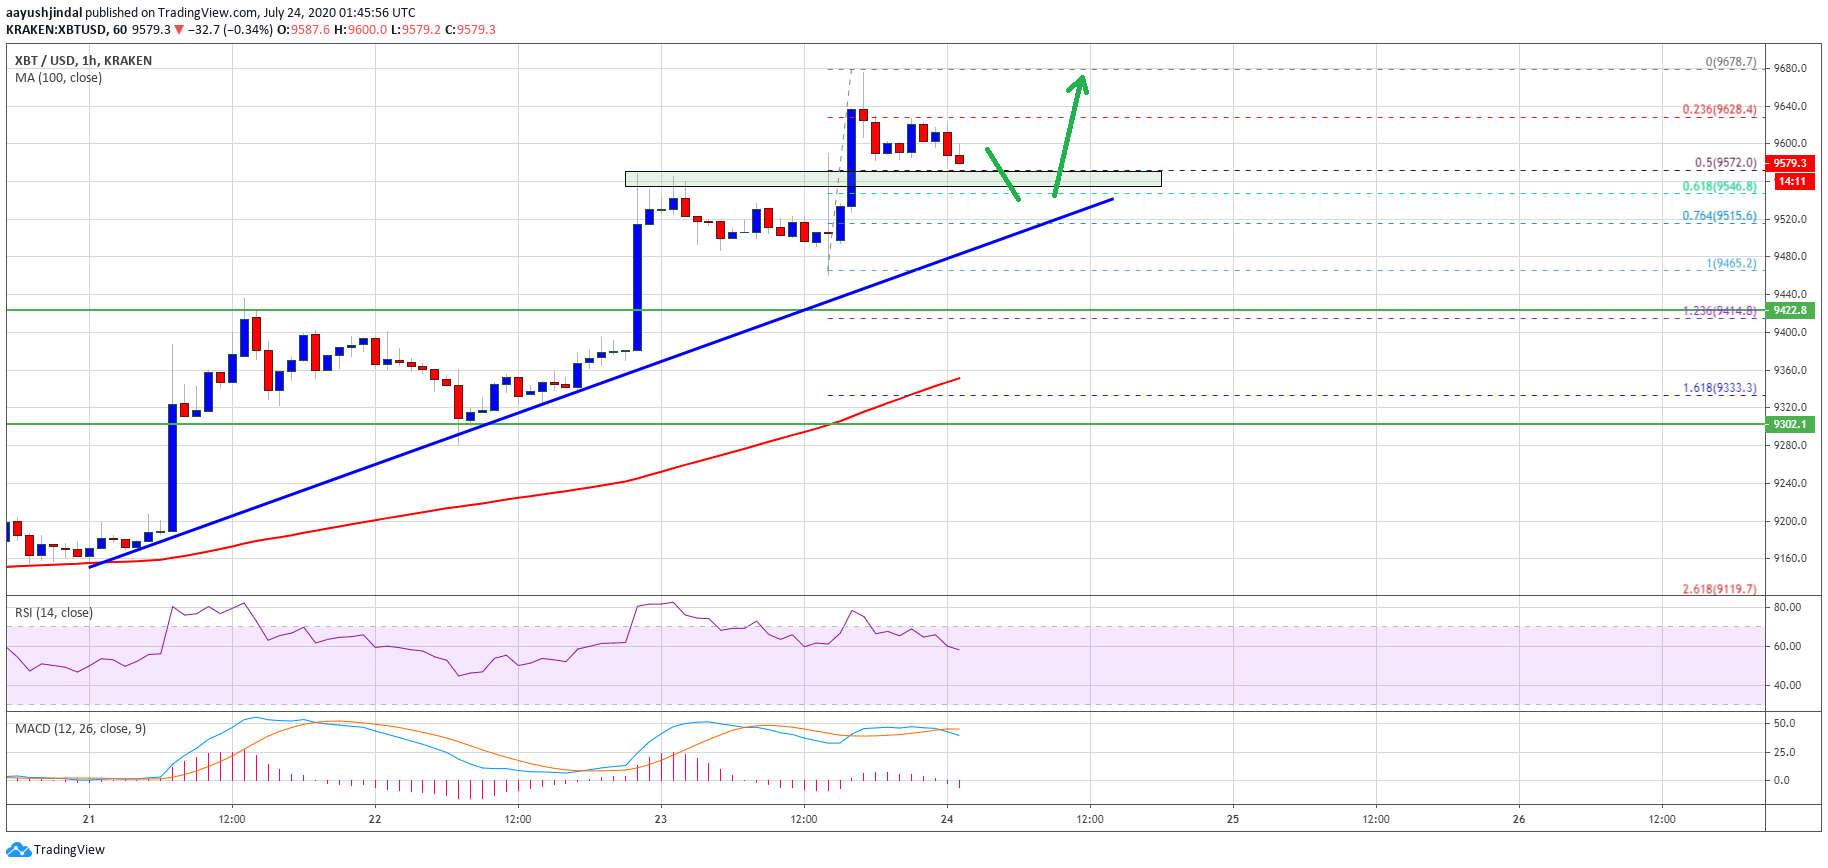
Bitcoin price settles above $9,500: Source: TradingView.com
As long as the price is above the trend line support, the price could resume its upside above the $9,600 level. An initial hurdle is near the $9,650 level, above which the price might climb towards $9,800. The main target for the bulls in the coming sessions may probably be $10,000.
Dips Likely Supported in BTC
If bitcoin corrects lower, the trend line support and $9,500 might play a major role. If there is a break below the trend line support, the price could continue to move down towards the $9,420 support area.
Any further losses may perhaps open the doors for a test of the $9,350 level or the 100 hourly simple moving average. The next major support is near the $9,300 level.
Technical indicators:
Hourly MACD – The MACD is slowly moving in the bearish zone.
Hourly RSI (Relative Strength Index) – The RSI for BTC/USD is correcting lower towards the 50 level.
Major Support Levels – $9,500, followed by $9,420.
Major Resistance Levels – $9,650, $9,800 and $10,000.


