
Reason to trust
How Our News is Made
Strict editorial policy that focuses on accuracy, relevance, and impartiality
Ad discliamer
Morbi pretium leo et nisl aliquam mollis. Quisque arcu lorem, ultricies quis pellentesque nec, ullamcorper eu odio.
Bitcoin found support near $11,120 and started an upward move against the US Dollar. However, BTC must break $11,650 and the 100 hourly SMA to start a fresh rally.
- Bitcoin is slowly recovering from the $11,150 and $11,200 support levels.
- The price is facing a couple of hurdles near the $11,600 and $11,650 levels.
- There is a major bearish trend line forming with resistance near $11,620 on the hourly chart of the BTC/USD pair (data feed from Kraken).
- The pair must clear the $11,650 resistance and the 100 hourly simple moving average to start a fresh rally.
Bitcoin Price is Facing Hurdles
Recently, we saw a sharp decline in bitcoin price below the $11,500 support level against the US Dollar. BTC even traded below the $11,200 support level and settled below the 100 hourly simple moving average.
A swing low was formed near $11,130 and the price started a slowly and steady recovery wave. It recovered above the $11,200 and $11,400 levels. There was a break above the 23.6% Fib retracement level of the recent decline from the $12,084 high to $11,130 low.
Bitcoin price even climbed above the $11,500 pivot level, but it is facing a strong resistance near $11,650. There is also a major bearish trend line forming with resistance near $11,620 on the hourly chart of the BTC/USD pair.
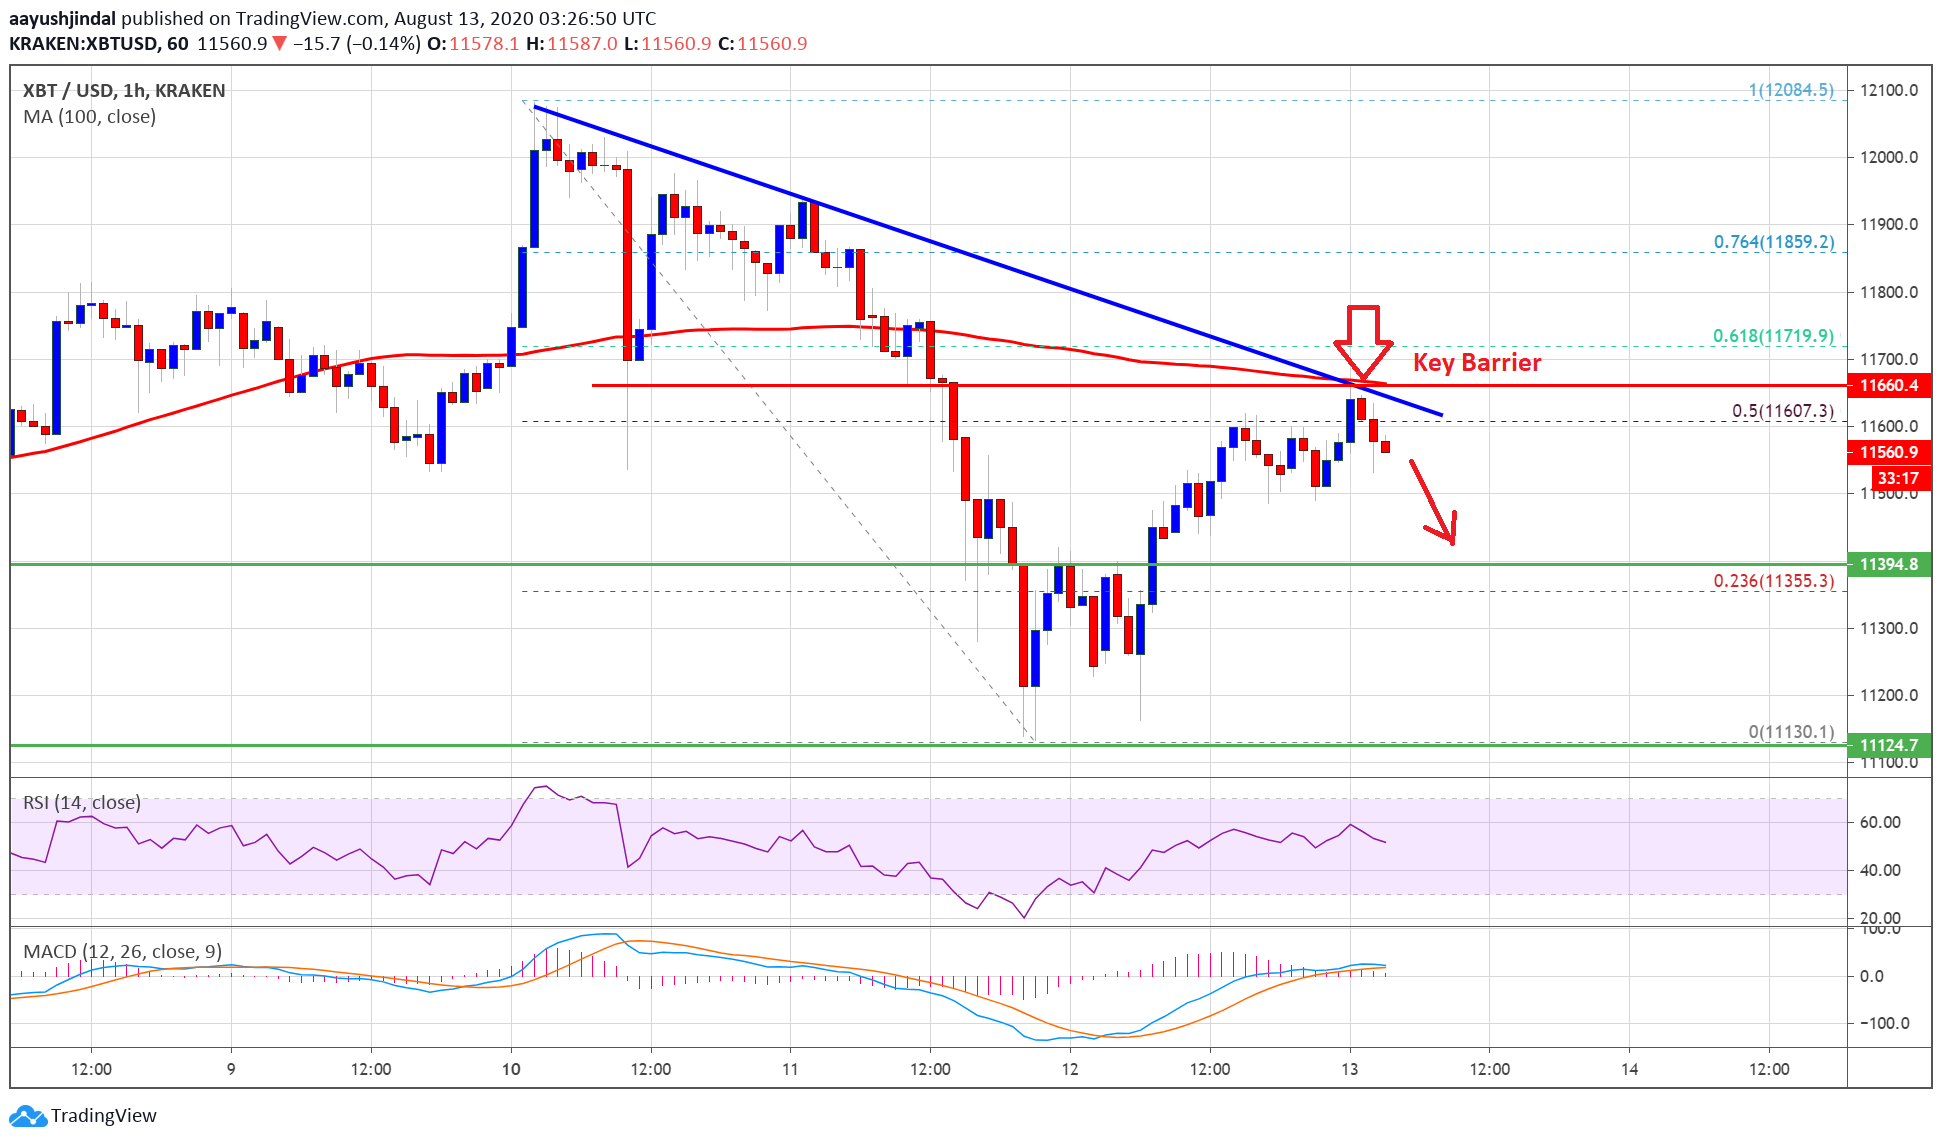
Bitcoin price trades above $11,200. Source: TradingView.com
The trend line is close to the 100 hourly SMA, which is preventing an upside break above the $11,650 level. The price is also struggling to close above the 50% Fib retracement level of the recent decline from the $12,084 high to $11,130 low.
If there is a successful break above the trend line, the 100 hourly SMA, and $11,650, the price is likely to start a strong rally. The next resistance is near the $11,800 level, above which the bulls are likely to aim more upsides above the $12,000 and $12,050 levels.
Fresh Decline in BTC?
If bitcoin fails to clear the trend line, the 100 hourly SMA, and $11,650, then there are chances of a fresh decline. An initial support is seen near the $11,400 level.
The main support is now near the $11,120 level, below which there is a risk of a sharp decline below the $11,000 support. In the mentioned case, the price could even test $10,500 (as discussed in yesterday’s analysis using the daily chart).
Technical indicators:
Hourly MACD – The MACD is about to move into the bearish zone.
Hourly RSI (Relative Strength Index) – The RSI for BTC/USD is currently sliding below the 50 level.
Major Support Levels – $11,400, followed by $11,120.
Major Resistance Levels – $11,650, $11,800 and $12,000.


