
Reason to trust
How Our News is Made
Strict editorial policy that focuses on accuracy, relevance, and impartiality
Ad discliamer
Morbi pretium leo et nisl aliquam mollis. Quisque arcu lorem, ultricies quis pellentesque nec, ullamcorper eu odio.
Bitcoin price is trading in a range above the $11,700 support zone against the US Dollar. BTC is likely to surge higher once it clears the main $12,000 resistance zone.
- Bitcoin is trading in a positive zone above the $11,700 and $11,750 support levels.
- The price is facing a strong resistance near $12,000, but it is following the 100 hourly SMA.
- There is a crucial breakout pattern forming with resistance near $11,950 on the hourly chart of the BTC/USD pair (data feed from Kraken).
- The pair could gain sharply once the bulls are able to clear the key $12,000 resistance zone.
Bitcoin Price is Stuck in a Range
In the past few hours, there were positive moves in bitcoin above the $11,600 level against the US Dollar. BTC was able to climb higher above the $11,700 and $11,800 levels.
There was also a close above the $11,700 level and the 100 hourly simple moving average. However, the price seems to be facing a strong resistance near the $12,000 level. The bulls made more than two attempts to clear $12,000, but they failed.
The last swing high was formed near $11,987 and the price is currently trading near the 23.6% Fib retracement level of the upward move from the $11,273 low to $11,987 high.
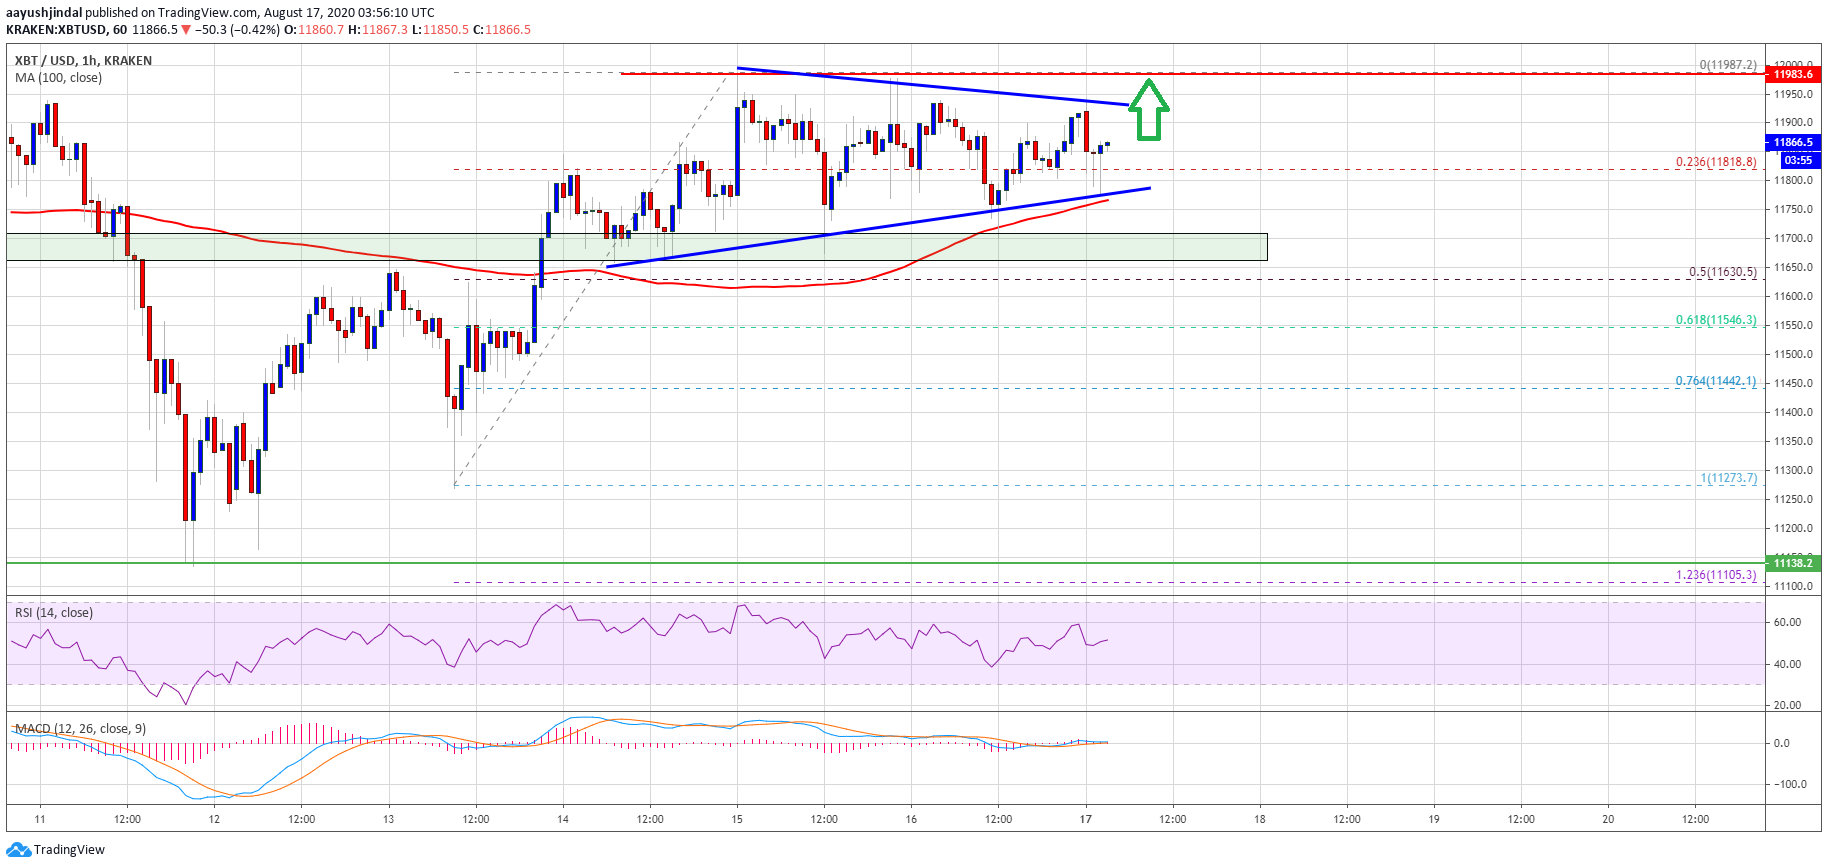
Bitcoin price trades above $11,750. Source: TradingView.com
It seems like there is a crucial breakout pattern forming with resistance near $11,950 on the hourly chart of the BTC/USD pair. If bitcoin price breaks the triangle resistance and $12,000, there are chances of a strong upward move in the coming sessions.
On the upside, there is a short-term resistance near the $12,050 level. A successful close above the $12,050 level might open the doors for a run towards the $12,500 level in the near term.
Bearish Break in BTC?
If bitcoin fails to clear the $12,000 resistance zone, there could be a bearish reaction. The triangle support is near the $11,750 level and the 100 hourly SMA.
The main support is forming near the $11,650 and $11,600 levels. The 50% Fib retracement level of the upward move from the $11,273 low to $11,987 high is also near the $11,630 level to provide support. Any further losses could lead the price towards the $11,200 level.
Technical indicators:
Hourly MACD – The MACD is slowly gaining pace in the bullish zone.
Hourly RSI (Relative Strength Index) – The RSI for BTC/USD is currently near the 50 level.
Major Support Levels – $11,750, followed by $11,650.
Major Resistance Levels – $12,000, $12,050 and $12,200.


