
Reason to trust
How Our News is Made
Strict editorial policy that focuses on accuracy, relevance, and impartiality
Ad discliamer
Morbi pretium leo et nisl aliquam mollis. Quisque arcu lorem, ultricies quis pellentesque nec, ullamcorper eu odio.
Ripple failed to extend gains above $0.2580 and declined sharply against the US Dollar. XRP price is likely to decline heavily if it breaks the key $0.2300 support zone.
- Ripple is now trading well below the $0.2400 and $0.2380 support levels against the US dollar.
- The price is facing many hurdles and it is now well below the 100 simple moving average (4-hours).
- There was a break below a crucial bullish trend line with support near $0.2440 on the 4-hours chart of the XRP/USD pair (data source from Kraken).
- The pair is likely to decline sharply if there is a close below $0.2300 and $0.2280.
Ripple Price is Testing Important Support
This week, we saw a fresh decline in bitcoin, Ethereum, and ripple. XRP price failed to stay above the $0.2500 and $0.2450 support levels, and moved into a bearish zone.
There was a sharp decline after there was a close below the $0.2440 support and 100 simple moving average (4-hours). More importantly, there was a break below a crucial bullish trend line with support near $0.2440 on the 4-hours chart of the XRP/USD pair.
The pair even traded below the $0.2320 support and traded as low as $0.2293. It is currently consolidating losses above a significant support zone near $0.2290-$0.2300.
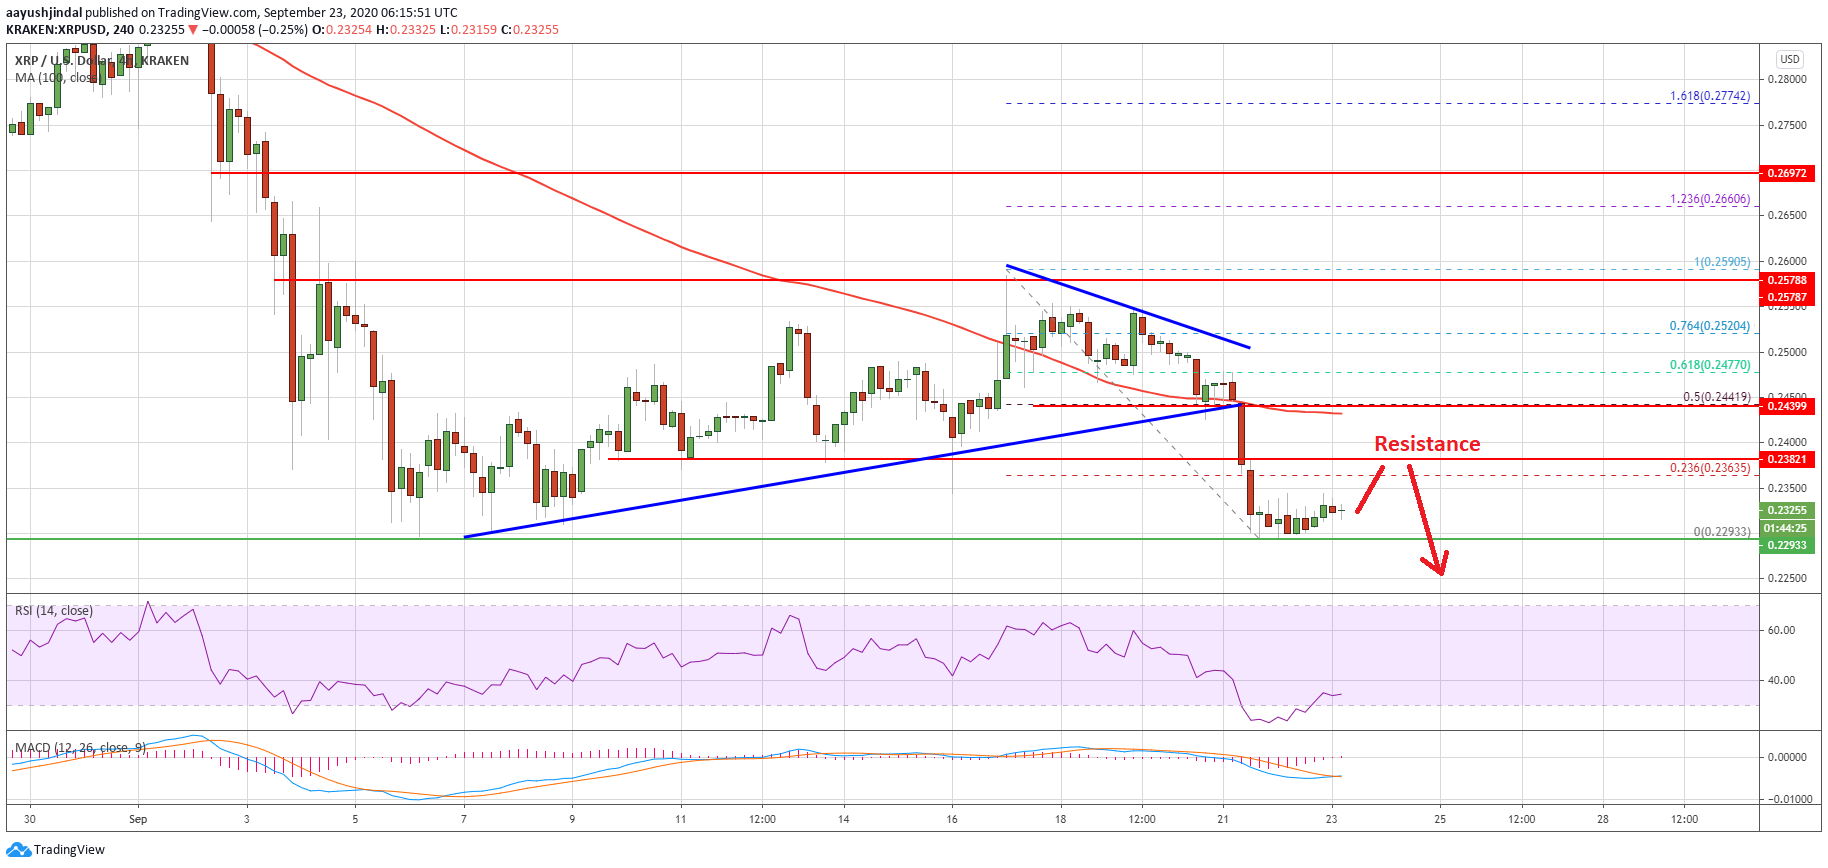
Ripple (XRP) price trades below $0.2350. Source: TradingView.com
On the upside, an initial resistance is near the $0.2360 level or the 23.6% Fib retracement level of the recent decline from the $0.2590 swing high to $0.2293 low. The main resistance is near the $0.2440 level (the recent breakdown zone) and the 100 simple moving average (4-hours).
The 50% Fib retracement level of the recent decline from the $0.2590 swing high to $0.2293 low is also near the $0.2440 level. A successful close above the $0.2440 resistance and the 100 SMA is must for a decent upward move in the near term.
More Losses in XRP?
If ripple fails to recover above the $0.2400 and $0.2440 resistance levels, there is a risk of more losses. The main breakdown support is forming near the $0.2290-$0.2300 zone.
A downside break and close below the $0.2290-$0.2300 zone could start a sharp decline. The next main support is near the $0.2200 level, below which the price could accelerate lower towards $0.2120.
Technical Indicators
4-Hours MACD – The MACD for XRP/USD is slowly losing pace in the bearish zone.
4-Hours RSI (Relative Strength Index) – The RSI for XRP/USD is well below the 50 level.
Major Support Levels – $0.2300, $0.2290 and $0.2200.
Major Resistance Levels – $0.2365, $0.2400 and $0.2440.


