It’s Friday evening and it’s time to take the second of our twice daily looks at what happened in the bitcoin price during the day and try to use the action we’ve seen to put something together for the evening.
We’re going to go at things a little different right now, however. Things are moving incredibly fast and we’re looking at what could potentially prove a live trade opportunity in the bitcoin price market.
As such, and in an attempt to avoid missing out on the trade in question, we’re going to jump right into the action and get the trade in place (if it plays out as expected).
So, take a very quick look at the chart below before we get going so as to get an idea where things stand. The chart is a one-minute candlestick chart and it’s got our key range overlaid in green.
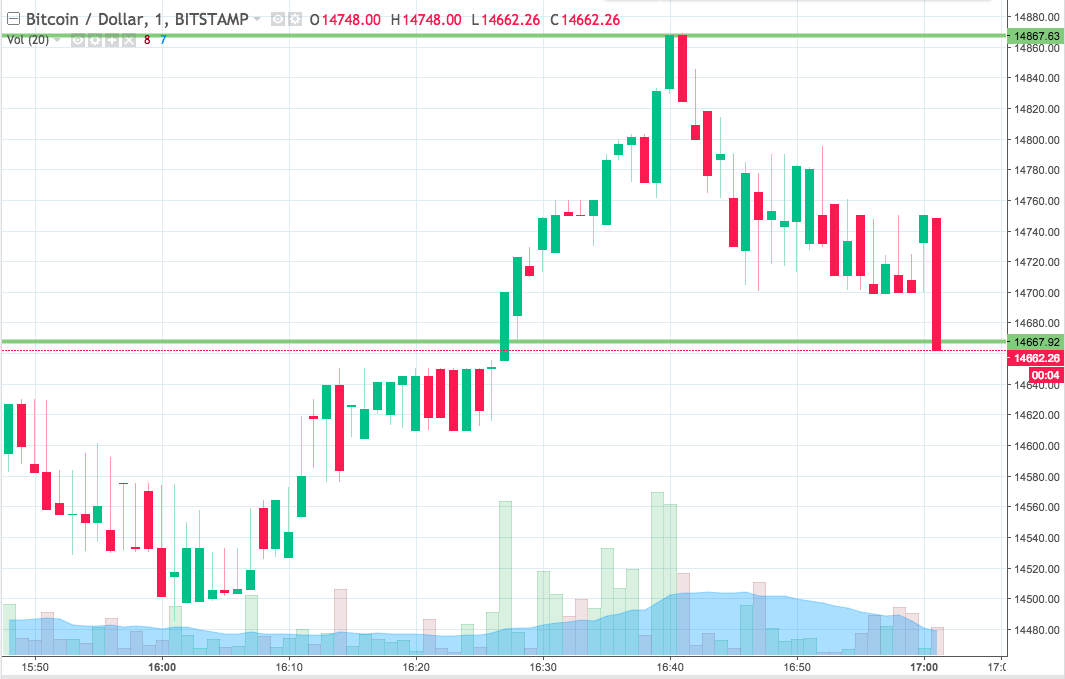

As the chart shows, then, the range that we are looking at for the session tonight comes in as defined by support to the downside at 14667 and resistance to the upside at 14867.
And it’s the former of these two levels that we are interested in right away.
The chart shows a candlestick breaking our downside support. If we see price close below this level (on this candlestick initially, but potentially near term on another), we’re going to get in short towards 14590. A stop on the position in and around 14690 will ensure we get taken out of the trade if things turn against us.
Looking the other way, if we see price close above resistance, we’ll enter what amounts to the same trade, just in the reverse. So, we’ll get in long towards an upside target of 14940 and we’ll place a stop at 14845 to define our risk on the position.
Let’s see what happens.
Charts courtesy of Trading View