So it is Friday morning and it’s time to take the first of our twice daily looks at how action the bitcoin price fared overnight and where we expect things to go as we move forward into the session today.
Given how fast things are moving right now, it’s probably reasonable to jump straight into our analysis as opposed to wasting any time trawling over historic action but, with that said, the chart below shows what happened over the last few hours so it’s well worth taking a look about before closing in on the details.
So, take a quick look at the chart below before we get started and, once complete, read on to find out where we are looking to jump in and out of the markets according to the rules of our intraday strategy. The chart is a one-minute candlestick chart and it has our primary range overlaid in green.
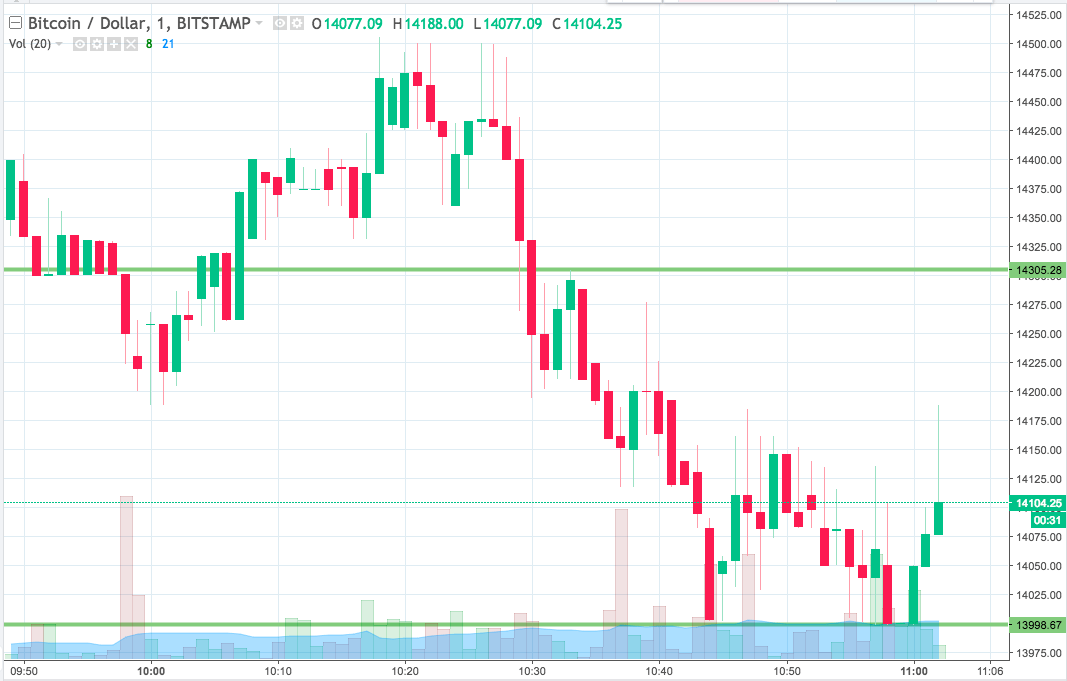

As the chart shows, the range we are looking at for the session this morning comes in as defined by support to the downside at 13998 and resistance to the upside at 14305.
Standard breakout rules apply for the session right off the bat so, if we see price close above resistance, we are going to look at using that close as an entry signal towards an immediate upside target of 14400. A stop loss on a position somewhere in the region of 14280 will ensure we are taken out of the trade if things turn against us and price reverses towards the opposite side of our bias.
Looking the other way, to the downside, a break below support will have us on the lookout for a close below that level and, if we get the close, it will signal a downside entry towards an immediate target of on 13920. A stop loss on this one at 14020 looks good.
Charts courtesy of Trading View