

It’s clear that holding coins in your portfolio is a “painful” thing right now. Before last week, we were bullish. However, following June 10 events and a consequent 15 percent Ethereum value erosion within 24 hours, there has been a calibration. In this new picture, sellers are spearheading this new chart driving prices below $500. If this pace continues, we are likely to see Ethereum at $350 in the coming days.
Let’s look at these charts:
From the News
There is a reason why any cryptocurrency coin supply is always but an important subject matter. A reasonable coin supply with coin burns is more often than not a sure way out of creating demand which in turn draws value. On the flip side, billions of total circulating coin supply and we shall have individual tokens going for less than a dollar. It’s a delicate balancing act and something whose determination lies with supply demand dynamics. So, with Ethereum printing a new total coin supply of 100 million, there are rising concerns of how ETH prices would react. Already online commentators are quick to link recent depreciation to this new revelation. Nonetheless, Ethereum coin holders must contend with this. Remember, there is no coin burn in Ethereum and it a measure that was adopted shortly after DAO hack.
#Ethereum's circulating supply passes 100M $ETH. https://t.co/78WJv0Jpz3 pic.twitter.com/fwlmU3R0fB
— CoinCodex (@CoinCodex) June 11, 2018
In other related news, Vitalik Buterin acknowledged the limited capacity within the network. During OmiseGo AMA session, he said if Ethereum TPS rose to 6, then it would have reached peak capacity. He went ahead and compares their network throughput with that of major stock exchanges and IoT. These platforms can can process hundreds of thousands of transactions per second. IoT for example market themselves saying they are infinitely scalable. Of course, there are real concerns that they must address if at all the network would turn out as robust and a go-to platform for developers.
Addressing scalability, they must because right now, Switzerland’s City of Zug is carrying out a pilot plan to digitize resident’s ID details using Ethereum’s UPort. It’s the first of the kind in this blockchain friendly city whose main objective is to test how secure their voting system would be once they incorporate blockchain.
Ethereum (ETH) Technical Analysis
Weekly Chart

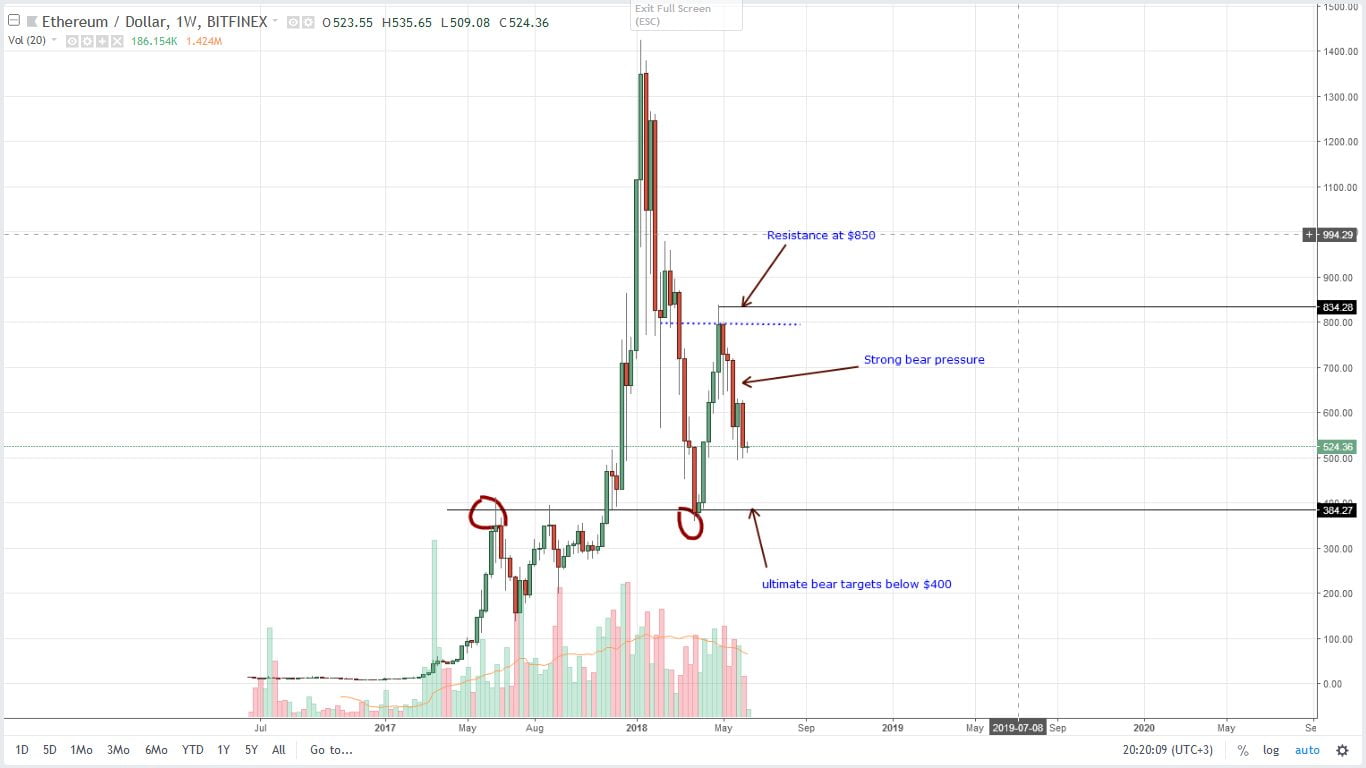
Like the rest of the markets, bears are in charge and with Ethereum down seven percent in the last 24 hours and 11 percent in the last seven days, sellers’ intention are clear. Even though we were positive expecting prices to appreciate in line with week ending June 3 bullish candlestick, last week’s depreciation negated our view. Buying in the midst of strong sellers was an optimistic approach. This is considering how the preceding candlestick was extremely bearish. So, since prices are below $550, our main support line, it’s only prudent for us to wait until we see strong moves below $500. Ideally, break below key support lines should draw with it high volumes and that’s what we should be watching out for assuming price action moves according to our trade plan.
Daily Chart
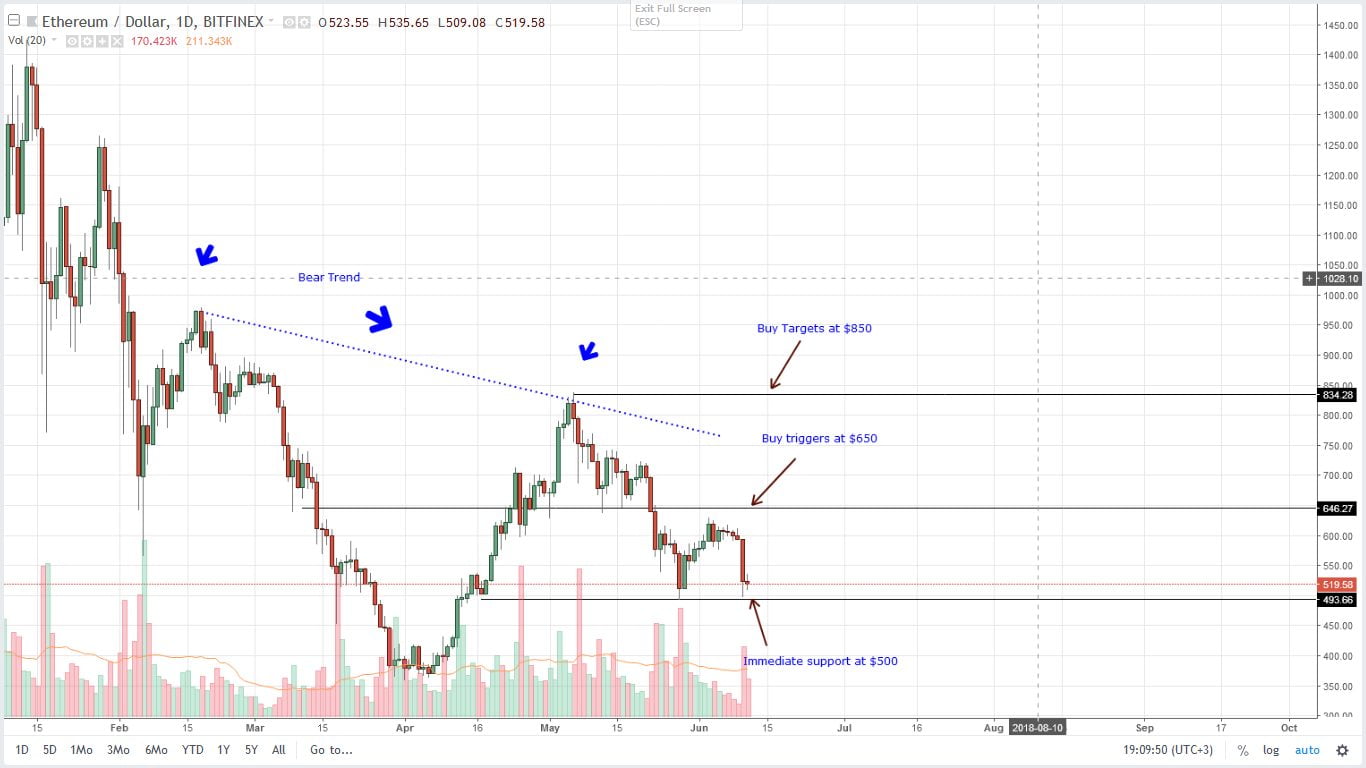
The sell off is clear and while at it, yesterday’s reluctance for a follow through is obvious. Well, it should be no point of concern because this is normal and often happens after periods of rapid depreciation/gains. From the weekly chart, I will recommend selling after breach below that conspicuous $500 line in the chart. Before then, I shall remain neutral until after our condition are met. If not, waiting for gains above $650 is another option that’s right on the table.