

As uncertainty in the broader market looms over the crypto space, some market pundits remain remarkably upbeat—especially when it comes to XRP.
A anonymous cryptocurrency analyst referred to as “Papa” sees XRP reaching a price of up to $14 despite the latest challenges besetting the digital money. The bold prediction comes amid XRP fighting to hold steady at the level of around $2 after experiencing four straight days of losses.
Market Sends Uncertain Signals On XRP Future
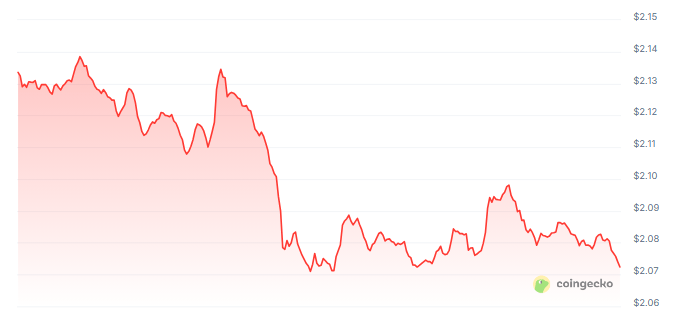
XRP last reached a two-week high of $2.24 on April 13 before pressure from selling took it down to $2.04 by Friday, April 18.
This 4% decline was the first instance since late March when XRP had recorded four consecutive days of falling prices. As per current technical markers, sentiment remains neutral while the Fear & Greed Index hovers at 39, solidly in “Fear” territory.
$XRP SCREAMING HIGHER 🚀 pic.twitter.com/DnRGTDs5x6
— PAPA♛ (@MamaGucci) April 19, 2025
In spite of these warning signs, Papa is convinced XRP is “screaming higher” according to chart patterns that reflect the cryptocurrency’s historic bull run of 2017-2018.

History May Repeat With New Chart Patterns
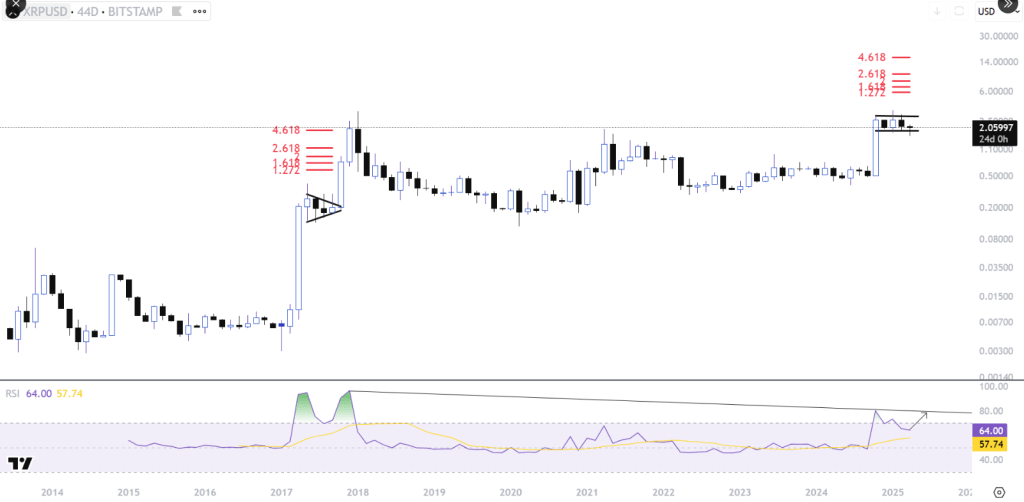
Reflecting on XRP’s most explosive growth phase, the analyst identifies a symmetrical triangle pattern that developed on a 44-day chart in the 2017-2018 bull market.
Following an initial 7,800% rise from $0.0055 in March 2017 to $0.3988 in May of that year, XRP consolidated before breaking out to hit its then-all-time high of $3.31 in January 2018—a breathtaking 1,760% rise from its low of $0.177.

Based on these figures, Papa observes similar trends emerging in the current market. In the present cycle, XRP rose 570% from November 2024 at $0.50 to an all-time high of $3.39 in January 2025. Since then, it has fallen 38% and spent three months consolidating.

Technical Indicators Hint At Double-Digit Prices
The analyst’s price targets are derived from Fibonacci extension levels—technical indicators that traders use to forecast price action. During its 2017-2018 run, XRP hit multiple Fibonacci targets at the 1.272, 1.618, 2.618, and 4.618 levels.
Featured image from CoinFlip, chart from TradingView