So that is another day out of the way, and it has been a pretty interesting one as far as volatility is concerned in the bitcoin price. When we kicked off the session this morning, we noted that action over the weekend had been relatively flat, And that we were hoping for a spike early in the session in order to get things moving again. As it turned out, we did get the volume spike, but it pushed price down, and we ended up trading lower than we were when we first started the session. This isn’t a bad thing for our intraday strategy – we get in both long and short depending on where action takes us – but from a long-term holding perspective, it is not great.
Anyway, that’s the way things have fallen, so let’s move into this evening’s session and try and outline some key levels to keep an eye on moving forward. As ever, take a quick look at the chart below to get an idea of the levels in focus.
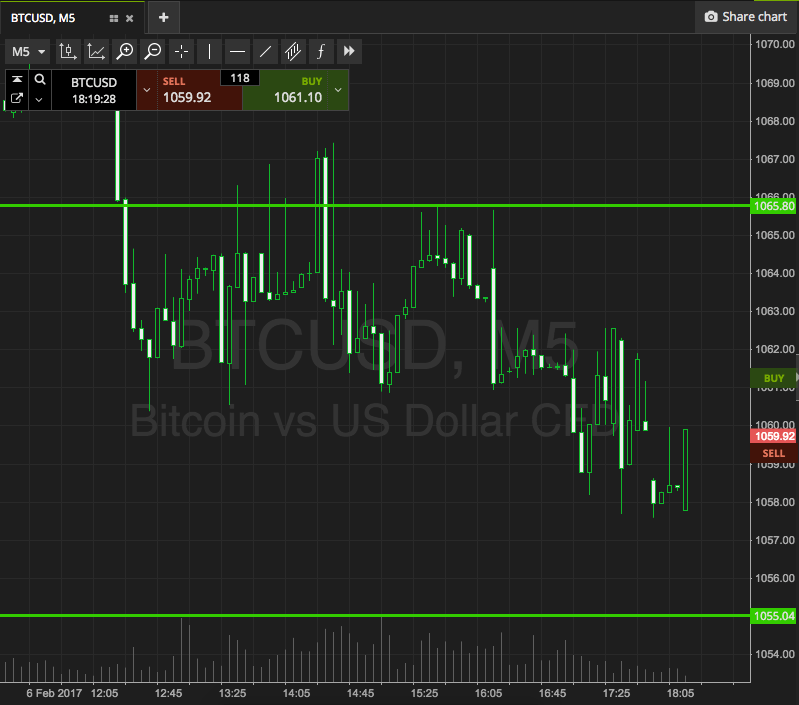

As the chart shows, the range we are looking at this evening is defined by support to the downside 1055, and resistance to the upside at 1065. With around a $10 range, there is just enough to go out from an intrarange perspective, so long at support and short at resistance. Stops just outside of the entry to define risk. From a breakout perspective, if we see price break through resistance, we will enter long towards an immediate upside target of 1075. A stop loss on the trade at 1061 defines risk. Conversely, if price breaks below support, we will enter towards 1045. On this one, a stop at 1058 will work to take us out of the trade in the event of a price reversal, and ensure that we are not stuck on the losing end of an irretrievable position.
Charts courtesy of SimpleFX.