
Reason to trust
How Our News is Made
Strict editorial policy that focuses on accuracy, relevance, and impartiality
Ad discliamer
Morbi pretium leo et nisl aliquam mollis. Quisque arcu lorem, ultricies quis pellentesque nec, ullamcorper eu odio.
Cardano price started a fresh increase from the $0.80 zone. ADA is now rising and might attempt a clear move above the $1.00 zone.
- ADA price started a fresh increase from the $0.80 support zone.
- The price is trading above $0.950 and the 100-hourly simple moving average.
- There is a key bullish trend line forming with support at $0.9350 on the hourly chart of the ADA/USD pair (data source from Kraken).
- The pair could extend gains if it clears the $1.00 resistance zone.
Cardano Price Eyes Steady Increase
After a sharp decline, Cardano found support near the $0.7650 zone and started a fresh increase, like Bitcoin and Ethereum. ADA was able to surpass the $0.80 and $0.850 resistance levels.
There was a clear move above the $0.850 and $0.950 resistance levels. Finally, the price traded close to the $1.00 level. A high was formed at $0.9880 and the price is now consolidating above the 23.6% Fib retracement level of the upward move from the $0.7653 swing low to the $0.9880 high.
Cardano price is now trading above $0.950 and the 100-hourly simple moving average. There is also a key bullish trend line forming with support at $0.9350 on the hourly chart of the ADA/USD pair.
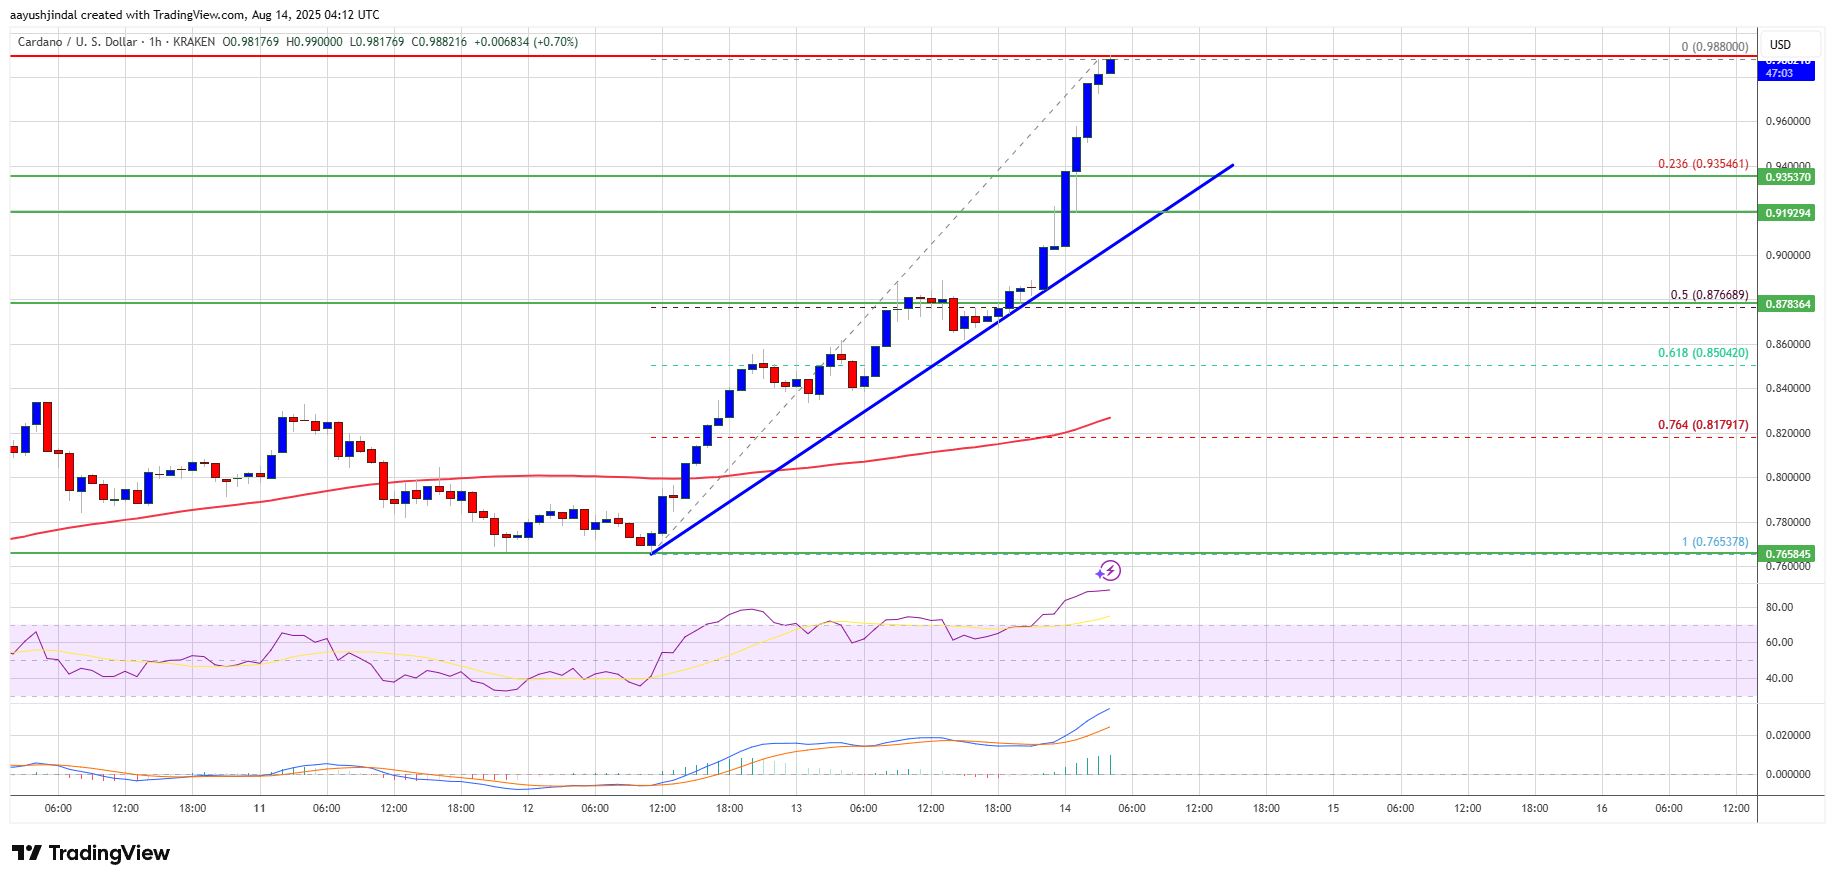
Source: ADAUSD on TradingView.com
On the upside, the price might face resistance near the $0.9880 zone. The first resistance is near $1.00. The next key resistance might be $1.020. If there is a close above the $1.020 resistance, the price could start a strong rally. In the stated case, the price could rise toward the $1.120 region. Any more gains might call for a move toward $1.150 in the near term.
Another Pullback In ADA?
If Cardano’s price fails to climb above the $1.00 resistance level, it could start another decline. Immediate support on the downside is near the $0.960 level.
The next major support is near the $0.9350 level and the trend line. A downside break below the $0.9350 level could open the doors for a test of $0.9120. The next major support is near the $0.880 level where the bulls might emerge.
Technical Indicators
Hourly MACD – The MACD for ADA/USD is gaining momentum in the bullish zone.
Hourly RSI (Relative Strength Index) – The RSI for ADA/USD is now above the 50 level.
Major Support Levels – $0.960 and $0.9350.
Major Resistance Levels – $0.9800 and $1.00.


