
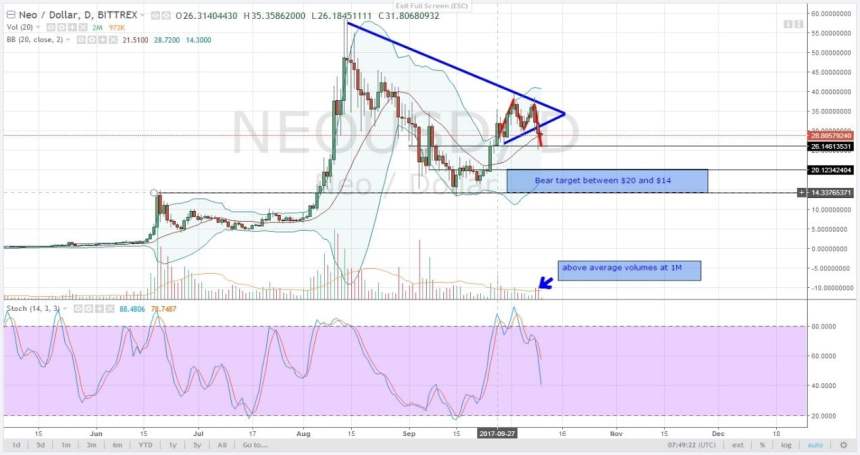
NEOUSD TECHNICAL ANALYSIS
Over two days and strong bear volume spikes-at 1M, price action broke through support trend line. Stochastics are still bearish and if price manages to stay below the 20 period moving average today, then the first bear target at $20 will likely be hit. Minor Support level of $26 is acting like a neckline in that M-formation. Advised from this technical formation, sellers initiating short positions in lower time frames should place a safe stop loss above yesterday’s highs of $34 while those who shorted yesterday are advised to move their stop losses to break even. Refer Figure 1 (above): NEOUSD-Daily Chart-10.10.2017
DASHUSD TECHNICAL ANALYSIS

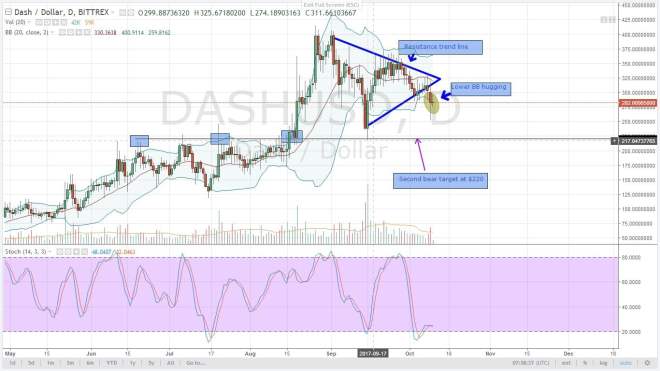
As yesterday’s candlestick closed, a bearish break out was confirmed. Yesterday’s candlestick was important not only because of that bear validation but by its intrinsic characteristics. Note the bear volume spikes breaking above daily average range meaning yesterday’s activity was full of bear participants who drove prices lower. Secondly, note how lower and upper BB are widening in response to increased volatility-price action moved $70 yesterday in contrast with daily averages of about $40. In doing so, the first Take Profit level at $270 was hit. As price action aligns with the lower BB-classic BB banding, sellers should be in charge. Second resistance turned support level of $220 should be the next target.
IOTUSD TECHNICAL ANALYSIS
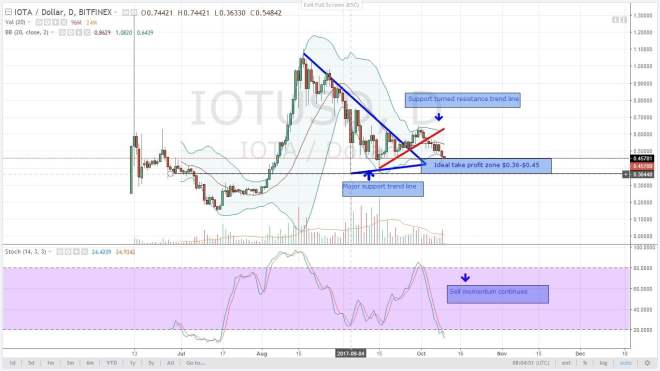
Immediate support of $0.50 was broken through yesterday as price oscillated lower. As price action continues to band along the lower BB, seller momentum as shown by the stochastic bear signal and bear volume spike-should continue. Given the buy-seller dynamics, the first level of strong price reaction is expected at 04.09.2017 and 15.09.2017 lows of $0.36. $0.36 is the lower range of our take profit zone on the daily chart and that is the ideal take profit level.
MONERO-XMRUSD TECHNICAL ANALYSIS
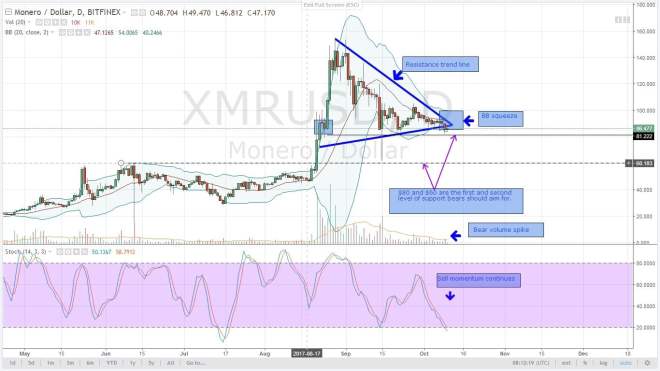
Finally, as yesterday’s candlestick closed, price action was boosted by bear volumes and spiked $8. In doing so, there was a break out below the support trend line and the wedge. Price also managed to close below the 20 period moving average and the momentum-sapping BB squeeze. Like all other major alt-coins, you can see seller momentum is high as lower BB banding begins to take shape. Bear targets at $80 and $60 are viable. As we were waiting for this bear break out, a safe stop losses should be above yesterday’s highs of $90.
LSKUSD TECHNICAL ANALYSIS
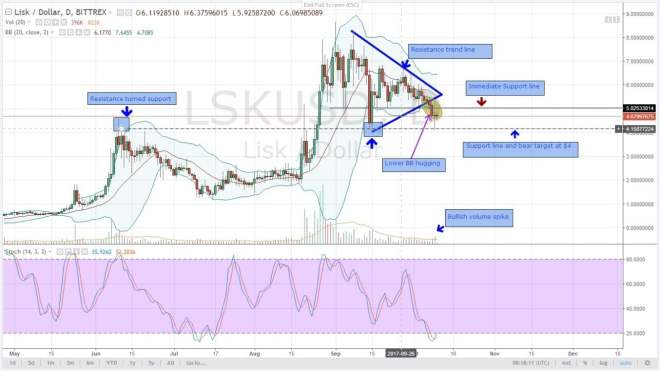
Yesterday’s candlestick was evenly matched between sellers and buyers as it closed as a doji. There was also a retest at $5.0 which is the support turned resistance trend line. However, the lower BB banding after yesterday’s close means USD demand is high. $4 remains a bear target but today’s close and nature of participants-buyers or sellers-will determine the short-to-medium trend of this pair.
Contributed by Dalmas Ngetich, an expert with 3 years in Forex, Commodity and Cryptocurrency trading. All charts, courtesy of Trading View