
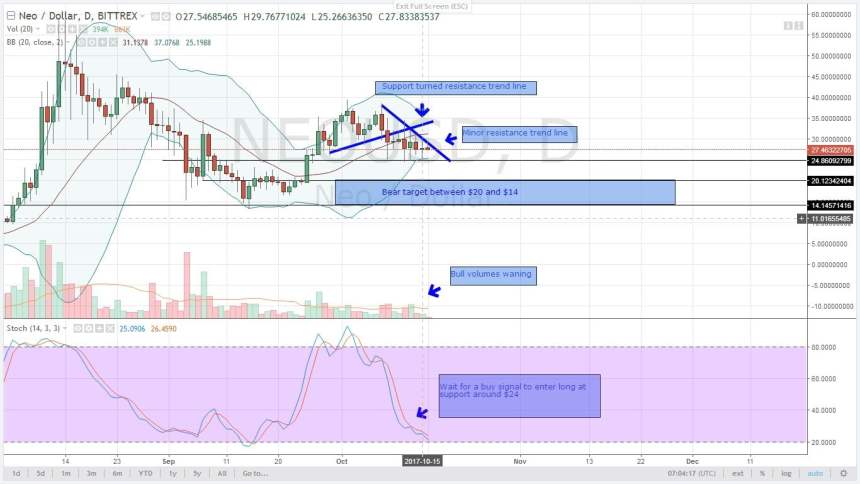
NEOUSD TECHNICAL ANALYSIS
That flash buy on Friday pushed NEO prices higher. However, since price movement over the weekend remained muted, the minor resistance trend line drawn from 08.10.2017 and 14.10.2017 highs and the 20 period MA is a lifeline for NEO bulls. Right now, the price is rejecting any price above $30 and continues to trend lower. Anyway, my deduction is simple, there is no buy signal which we expected after that bullish push on Friday and consequent bull volumes are waning. Break below support of $24 means sellers are in charge and USD bulls are in the trade. Conversely, break above $32 resistance triggers NEO bulls. Refer Figure 1 (Above): NEOUSD-Daily Chart-16.10.2017
DASHUSD TECHNICAL ANALYSIS

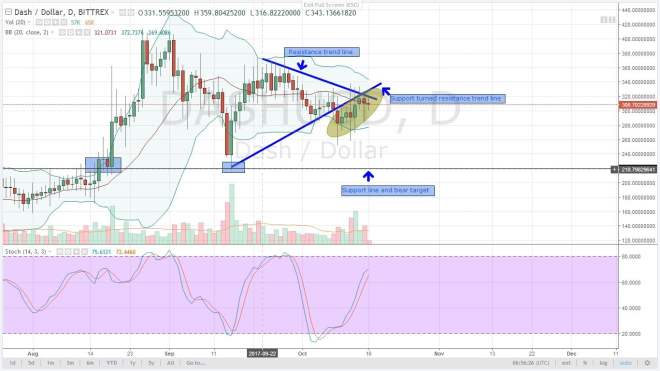
Price is oscillating within a tight $80 range marked by 12.10.2017 doji candlestick. By any standard, bull price rejection happens around $330 to $340 which is a resistance confluence zone marked by the resistance trend line-that between 24.09.2017 and 12.10.2017 highs and the support turned resistance drawn from 14.09.2017 and 05.10.2017 lows. My recommendation is patience until there is a break above $340 for bull entry or if in case that resistance trend line stands and the bear trend continues, sellers should join in below $250 which is a safe entry zone. Either way, there is a buy signal in place but these whipsaws and dojis give mix signals which is not beneficial for trend traders. We remain neutral as we watch stochastics and volume behavior to predict the most probable trend direction.
IOTUSD TECHNICAL ANALYSIS
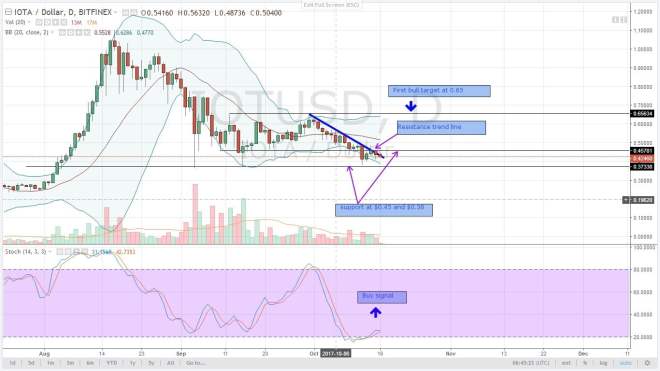
Buy momentum is sustained as shown by stochastics and on another level, the resistance trend line managed to rebuff any price appreciation above $0.45. On these three days when prices were constricted within a tight $0.10 range defined from 12.10.2017 Hi-Los, volumes remained tepid and on a negative trajectory after recording a record 19M. The 19M surge in bear volumes was the force behind that bear candlestick which closed below $0.45. Following my Saturday’s recommendation, bull trigger happens when there is a break above $0.48 highs of 12.10.2017 and a consequent break above 30.09.2017 and 12.10.2017 resistance trend line. Important bear levels remain at $0.38 which is 04.09.2017, 15.09.2017 and 12.10.2017 support levels.
MONERO-XMRUSD TECHNICAL ANALYSIS

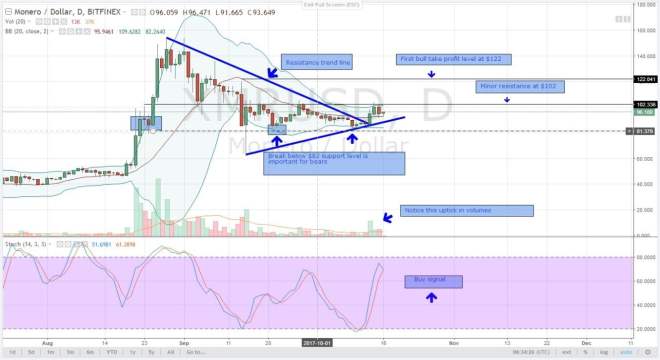
There was a brief price appreciation on Saturday before a correction on Sunday. For the record, price tested 23.08.2017, 15.09.2017 and 27.09.2017 highs of $102. That level is turning out to be significant for bulls. In the meantime though, correction towards the support trend line or the 20 period moving average around $86 to $95 provides a wonderful opportunity for bulls to buy at a cheap and aim for that resistance level at $122 as long as there is a buy signal and increasing momentum. Also, notice how volumes have been sustained above 25K daily average in the past 3 days. There is obvious supply-demand push and pull at these current price levels.
LSKUSD TECHNICAL ANALYSIS
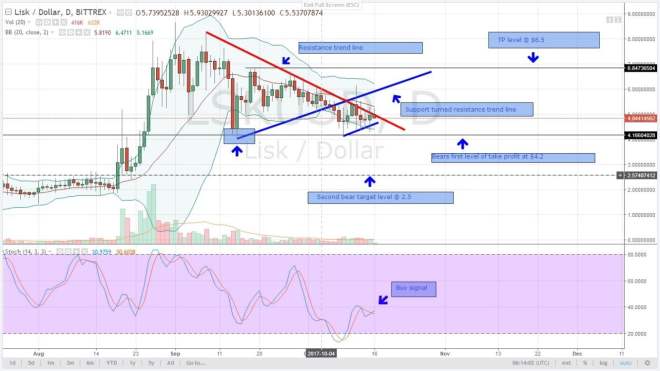
Despite across the board bull pressure in most alt-coins, USD bulls are pushing LSK down. On Saturday, we mentioned that as long as prices remain below that resistance trend line then we remain bears until when there is a clear push above. That should be accompanied by a strong bullish engulfing pattern or a two-bar reversal pattern. In this case, though, price action remains within 12.10.2017 Hi-Los and that minor support trend line connecting 09.10.2017 and 14.10.2017 lows still holds. There is a buy signal but bear volumes are still below the daily average trading range and therefore, today’s candlestick can lead to a break above resistance or below minor support for bear trend continuation. We remain neutral for now until a clear trend is defined.
Contributed by Dalmas Ngetich, an expert with 3 years in Forex, Commodity and Cryptocurrency trading. All charts, courtesy of Trading View