
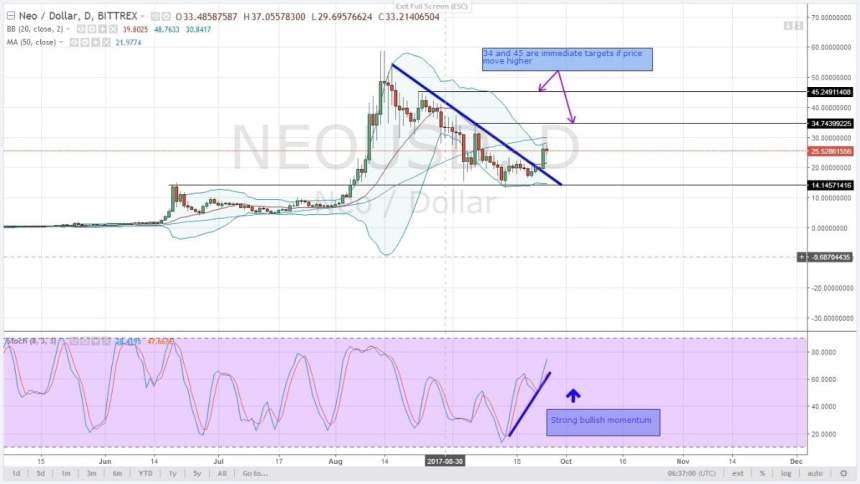
NEOUSD TECHNICAL ANALYSIS
Major resistance trend line was broken on 24.09.2017 and confirmed yesterday when that bullish candlestick was printed. It is also obvious from stochastics behavior that bulls are entering the market with clear buy signals first printed on 15.09.2017 and again after yesterday’s close. I’m bullish and my first target will be support turned resistance at 34.00, and then 45.00 if the bulls increase their momentum. Refer Figure 1: NEOUSD-Daily Chart-26.09.2017 (above)
DASHUSD TECHNICAL ANALYSIS

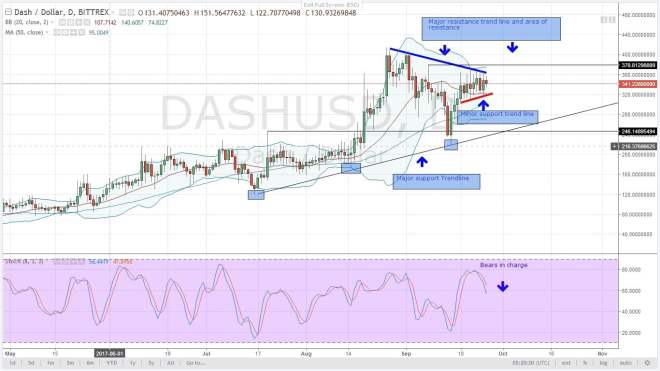
For seven straight trading days, price action has been accumulating in a narrow range between the minor support trend line of 301.00 lows of 19.09.2017 and 24.09.2017 highs of 375.00. During this time, price tested resistance trend line and that general zone of resistance. At the same time, stochastics are strongly bearish and the 50 period MA is acting as respectable support line confining price between 317.00 and 370.00. For now, I will be neutral, taking a wait and see approach until today’s close and candlestick characteristic is determined. Most importantly, that major resistance line should stand for my bearish forecast to hold.
IOTUSD TECHNICAL ANALYSIS
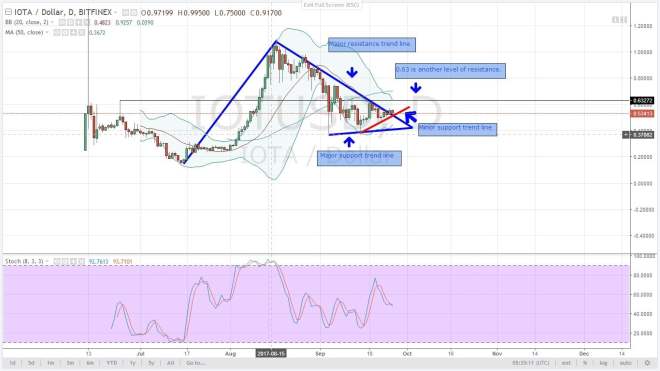
Something important happened yesterday and if sustained today, it will spell the beginning of a new move up. Well, the major resistance trend line and the 50 period MA was broken. It also meant that the minor support trend line, drawn from 15.09.2017 and 22.09.2017 lows held and propelled prices higher. At 0.57, which was 25.09.2017 highs, it is important to wait and see if the price will appreciate because stochastics is generally mixed with no clear signal pointing to either direction. If price continues to rise, then 24.06.2017 and 18.09.2017 highs of 0.63 will be our next reaction level.
MONERO-XMRUSD TECHNICAL ANALYSIS
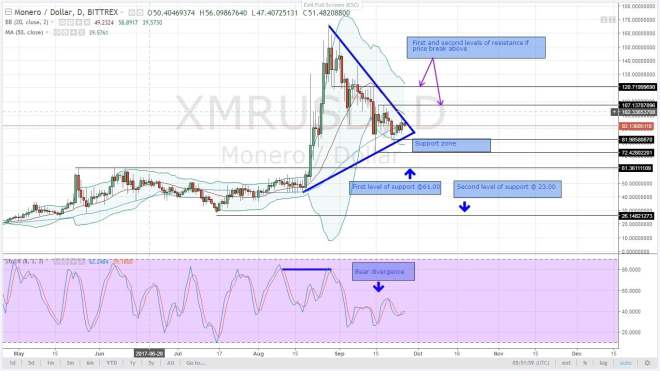
After that classic bear divergence and consequent correction to current levels, price action is at a precarious position. So far, price action is bound by that major resistance trend line and the 50 period MA to the upside between 94.00-100 and that potential drop below support spelled between 72 and 85. Yesterday’s high of 97.22 tested our resistance trend line. If that is sustained today with candlesticks forming bullish soldiers and diverging bullish stochastics, our potential buy target should be 108 and 122 to the upside. Alternatively, if resistance stands and bear trend continues, wait for a test of support at 81, 71, 61 and then 26 on the lower side.
NEMUSD TECHNICAL ANALYSIS
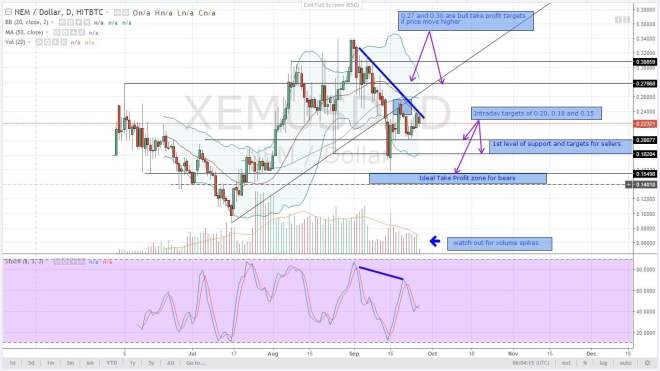
After 23.09.2017 to 25.09.2017 charge up, the 50 period MA and the resistance trend line held and the price is reversing. I remain a bear on this pair and two technical developments can change my view. First, there is a strong break above resistance trend line accompanied by high volumes with a test of recent highs of 0.25 recorded on 19.09.2017. Secondly, if there is clear buy signal printed by stochastics with diverging %k and %d. If these two conditions are met, then my first target will be 0.278-which is also support turned resistance- and then 0.307. Otherwise, my targets should remain the same as yesterday.
Contributed by Dalmas Ngetich, an expert with 3 years in Forex, Commodity and Cryptocurrency trading. All charts, courtesy of Trading View