
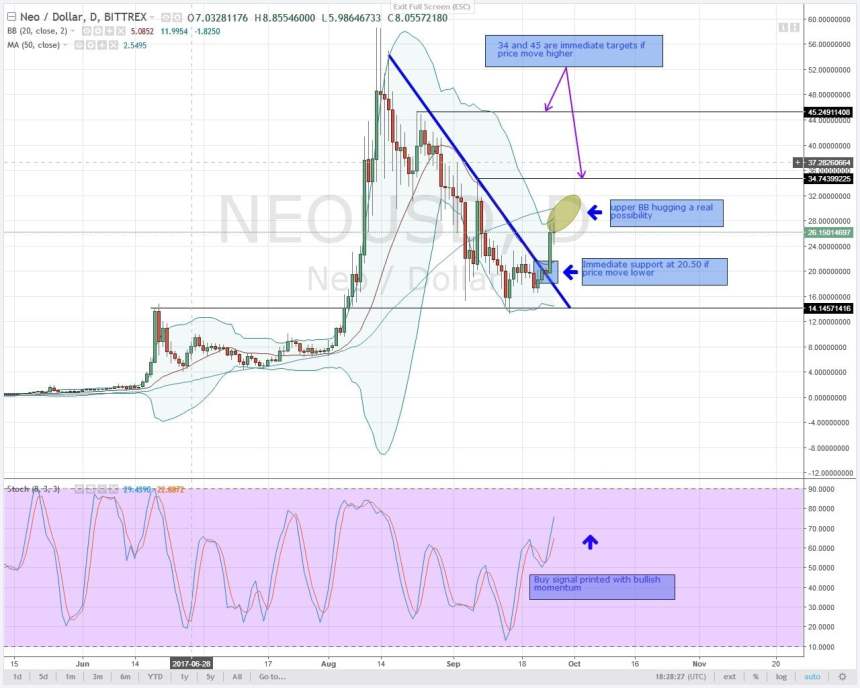
NEOUSD TECHNICAL ANALYSIS
Yesterday’s candlestick closed as a doji in the sense that there was clear buying pressure after that long lower wick. Even though price swings were limited to 3.00 points in contrast to Monday’s 8.00(Hi-Lo 17, 18), the price is on course of moving higher. I will expect more bullish momentum especially if there is upper BB hugging as price diverge further away from the lower BB. Going forward, the 50-period Ma and the major resistance trend line will be our region of support at around 20.50. Bulls will target the first level of resistance at 34.00 as long as stochastics buy signal remains. Refer Figure 1: NEOUSD-Daily Chart-27.09.2017 (above).
DASHUSD TECHNICAL ANALYSIS

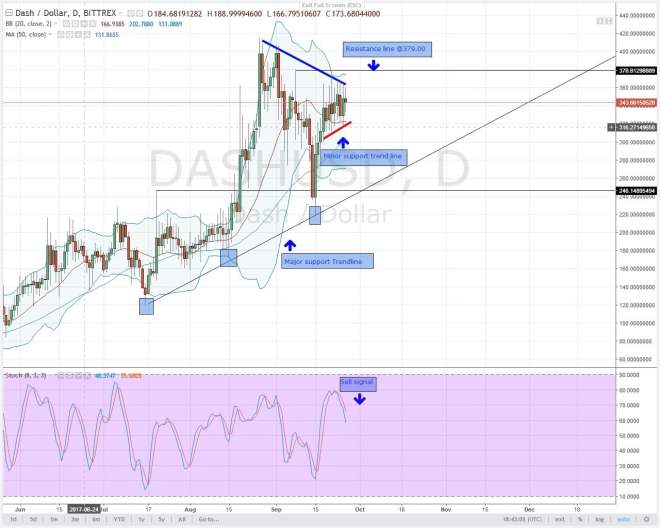
If you are keen, then you will notice that over the past three trading days, price action has been testing the main resistance trend line at 367.00 but there is something else happening. Price up is not being fuelled by positive momentum and as a result, you notice those two lower highs printed on Sunday and Monday. Price action is also confined in a triangle bound between 310 and 370 over a 9 day trading period. Advised by these technical developments, I will not recommend entry in either direction only until a significant break below minor support-or 50-period MA- or major resistance trend line happens.
IOTUSD TECHNICAL ANALYSIS
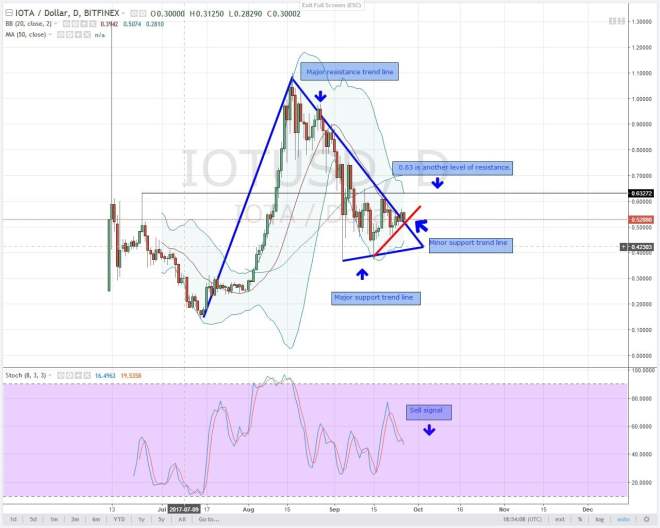
Oscillating within 0.56 and 0.51, the price was actually choppy yesterday and right within Monday’s range of 0.57 and 0.51. Same as yesterday’s recommendation, I will take a wait and see approach because there is no definite trend as stochastics signals are mixed and not at the overbought or oversold territories. The minor support trend line and the 50 period MA at 0.51 will be our support level. If there is a confirmation today of lower lows which will be in line with bear signal printed by stochastics, then I will recommend intra-day entry of sell signals in lower time frames tomorrow.
MONERO-XMRUSD TECHNICAL ANALYSIS
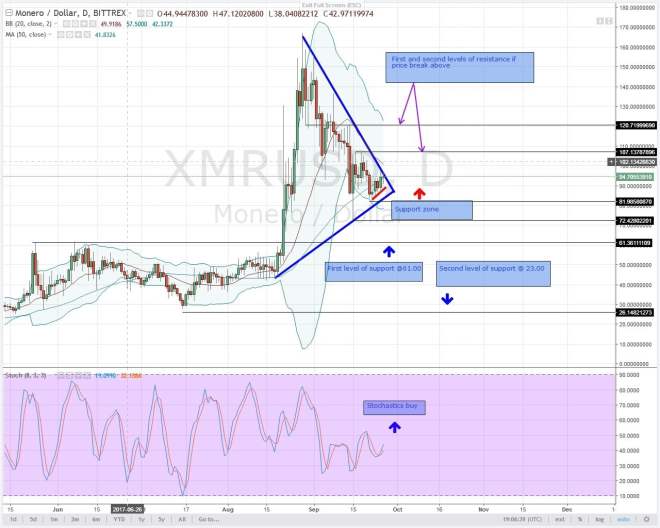
In 5 trading days, price action has continued to chart not far away from that major support trend line drawn from 18.08.2017 and 15.09.2017 lows. At 83.00 last recorded on 22.09.2017 before those bullish soldiers that are testing the current major resistance trend line, price tested support zone. Since there is price momentum up as pointed out by yesterday’s candlestick characteristic and stochastics, I will expect a break above 50-period MA at 101.00 with the first target at 107.00. I recommend stochastic long entries in lower time frame with oversold stochastics.
NEMUSD TECHNICAL ANALYSIS
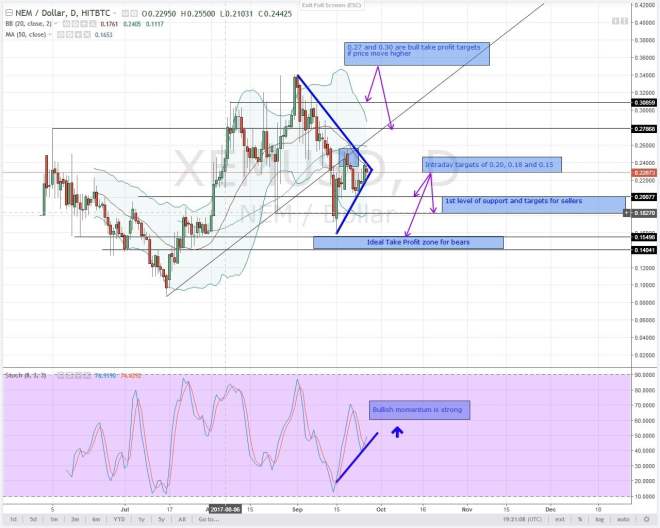
Just like Monday, price action failed to break through the 0.24 barrier as yesterday’s candlestick closed. This level is a region of resistance where the price has failed to break and close above on 3 different occasions. On 06.09.2017, 08.09.2017 and 26.09.2017 price tested this resistance line and moved lower with bearish signals printed by stochastics. Over the past 12 or so trading days, the price has been testing support trend line drawn between 15.09.2017 and 23.09.2017 lows and so far, there is no breach in either direction. However, upward momentum is strong and I’m bullish based on yesterday’s candlestick characteristic which closed with long lower wicks. I will only buy and retain bull targets if there is a break above 0.25 and a strong bullish candle today.
Contributed by Dalmas Ngetich, an expert with 3 years in Forex, Commodity and Cryptocurrency trading. All charts, courtesy of Trading View