
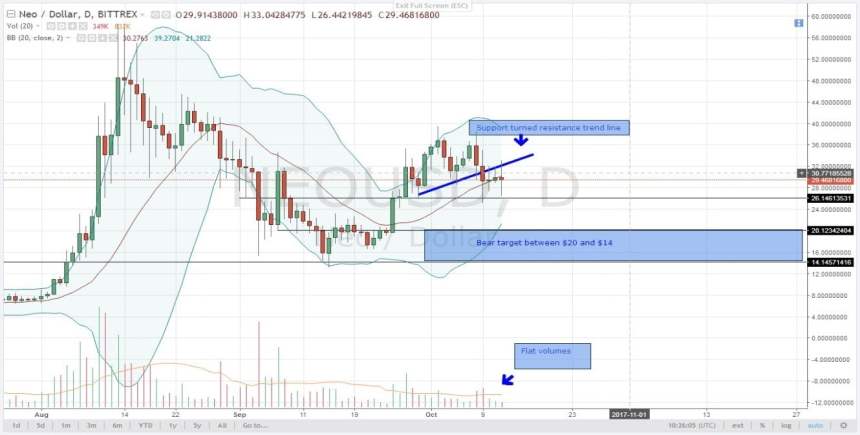
NEOUSD TECHNICAL ANALYSIS
Including today’s candlestick, we can conclude that the last 3 candlesticks were presentative of a horizontal consolidation resulting into dojis. The technical term for such formation is a “spinning top”. In the real sense, there was reduced volatility and participation levels remain flat over the same period as shown by below average volumes. Furthermore, the price is still oscillating within 09.10.2017 Hi-Los-a tight $9 range. However, chances of a break below temporary support of $25, and a consequent bear trigger remains high. Sellers should actually begin selling and aim at $20 and $14 respectively. A reliable stop loss should be placed above today’s highs at around $30. Refer Figure 1 (above): NEOUSD-Daily Chart-12.10.2017
DASHUSD TECHNICAL ANALYSIS

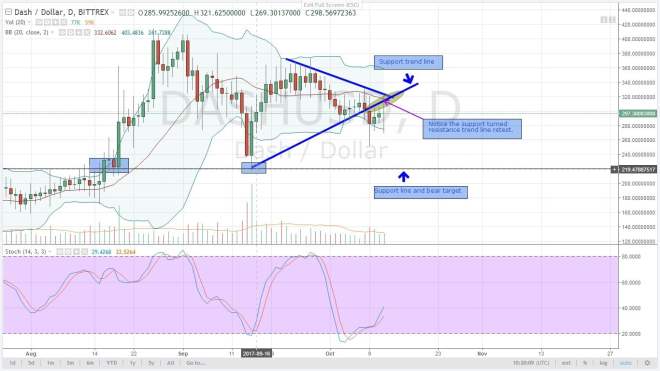
Yesterday’s and today’s candlesticks ended up testing support turned resistance trend line and the 20 period MA as price moved higher above $315. It is also likely that today’s candlestick might end up as a doji with a long upper wick meaning sell pressure. If sustained, then we retain our bear forecast and enter short in short time frames-I recommend 4hr chart and nothing lower by the way. I will reiterate that any bullish price close above $320 accompanied by a sharp bullish volume spike means canceling our short projections. Overly, I remain bearish and the recent DASH appreciation offers a perfect shorting opportunity. Sellers should enter short, place a stop loss above $320 and aim at $220.
IOTUSD TECHNICAL ANALYSIS
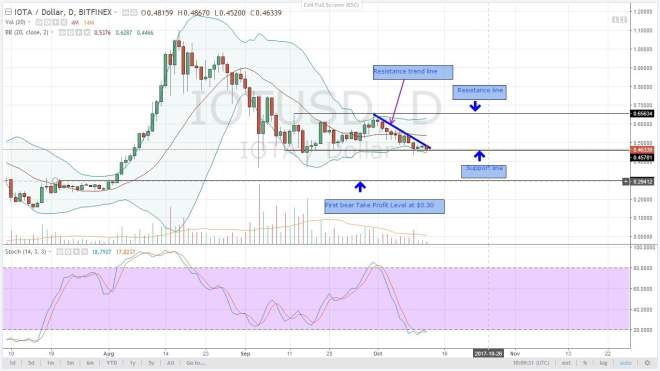
At the end of the day, the resistance trend line drawn from 30.09.2017 and 08.10.2017 highs managed to reject further price appreciation. With a highs of around $0.49, yesterday’s candlestick closed as a doji and was followed by further price erosion today. $0.45 is our support and it is likely that it will be broken. If it happens, sellers should initiate positions with a stop loss above $0.50 and aim at $0.30 which is another resistance turned support.
MONERO-XMRUSD TECHNICAL ANALYSIS

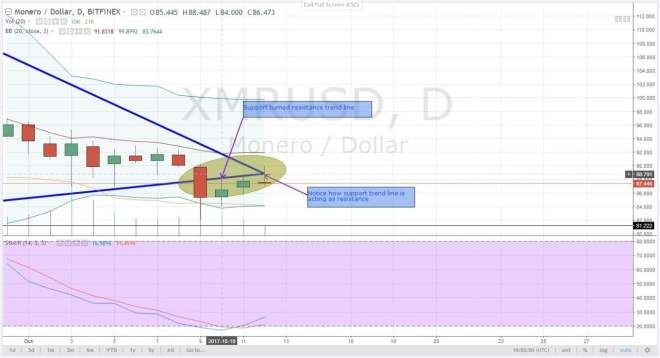
I had to zoom this out for you to clearly see. One thing is for sure, there was a clear break below support trend line on 09.10.2017 and that constituted a bear break out. No doubt about that. Secondly, as a feature of a breakout, there must be a retest. The support turned resistance trend line was retested on 10.10.2017 and 11.10.2017 at around $86. Today price reached a high of $89 but then look at the sell pressure. Bears are jumping in and driving prices lower as shown by that long upper wick resulting in a temporary inverted hammer as the day progress. Given these technical formations, I’m net bearish.
LSKUSD TECHNICAL ANALYSIS
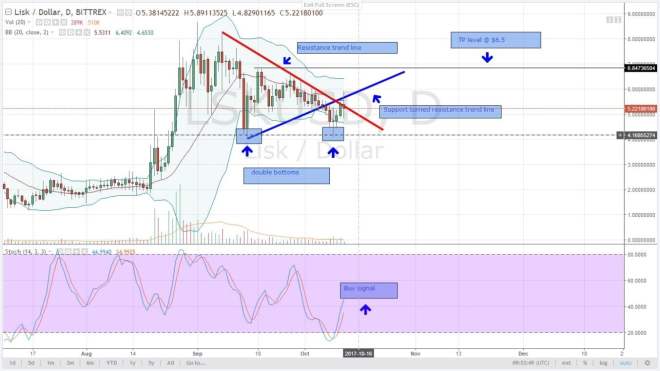
Over the last 4 days, a classic Evening Star reversal pattern was formed. In fact, with a high of $5.5 on 11.10.2017, price action tested the all-important support turned resistance trend line. This level of resistance defines price action trend in the short term. As indicated yesterday, it is imperative for prices to stay below $5.5 if bears are to profit. Today, prices trended even higher testing $5.9. However, candlestick characteristics show that price was quickly rejected and sellers jumped in as shown by that long upper wick. Price is currently just below the daily resistance trend line and the 20 period MA at around $5.2. Further depreciation means that daily resistance level holds and we continue selling.
Contributed by Dalmas Ngetich, an expert with 3 years in Forex, Commodity and Cryptocurrency trading. All charts, courtesy of Trading View