
Reason to trust
How Our News is Made
Strict editorial policy that focuses on accuracy, relevance, and impartiality
Ad discliamer
Morbi pretium leo et nisl aliquam mollis. Quisque arcu lorem, ultricies quis pellentesque nec, ullamcorper eu odio.
Bitcoin Cash price started a downside correction and tested $250 against the US Dollar. BCH is rising and might gain pace if it clears the $300 resistance.
- Bitcoin cash price is moving higher from the $250 support level against the US Dollar.
- The price is trading above $265 and the 100 simple moving average (4 hours).
- There was a break above a key bearish trend line with resistance near $270 on the 4-hour chart of the BCH/USD pair (data feed from Kraken).
- The pair is likely to accelerate further higher if it clears $290 and $300.
Bitcoin Cash Price Holds Ground
After a strong rally, Bitcoin Cash price faced sellers near the $335 zone. BCH traded as high as $333 and started a downside correction. There was a move below the $300 pivot level.
The price even declined below $265 before the bulls appeared near $250. A low is formed near $248 and the price is now slowly moving higher. There was a break above a key bearish trend line with resistance near $270 on the 4-hour chart of the BCH/USD pair.
Bitcoin Cash is trading above $265 and the 100 simple moving average (4 hours) and showing positive signs, unlike Bitcoin and Ethereum. Immediate resistance is near the $290 level. It is close to the 50% Fib retracement level of the downward move from the $333 high to the $248 low.
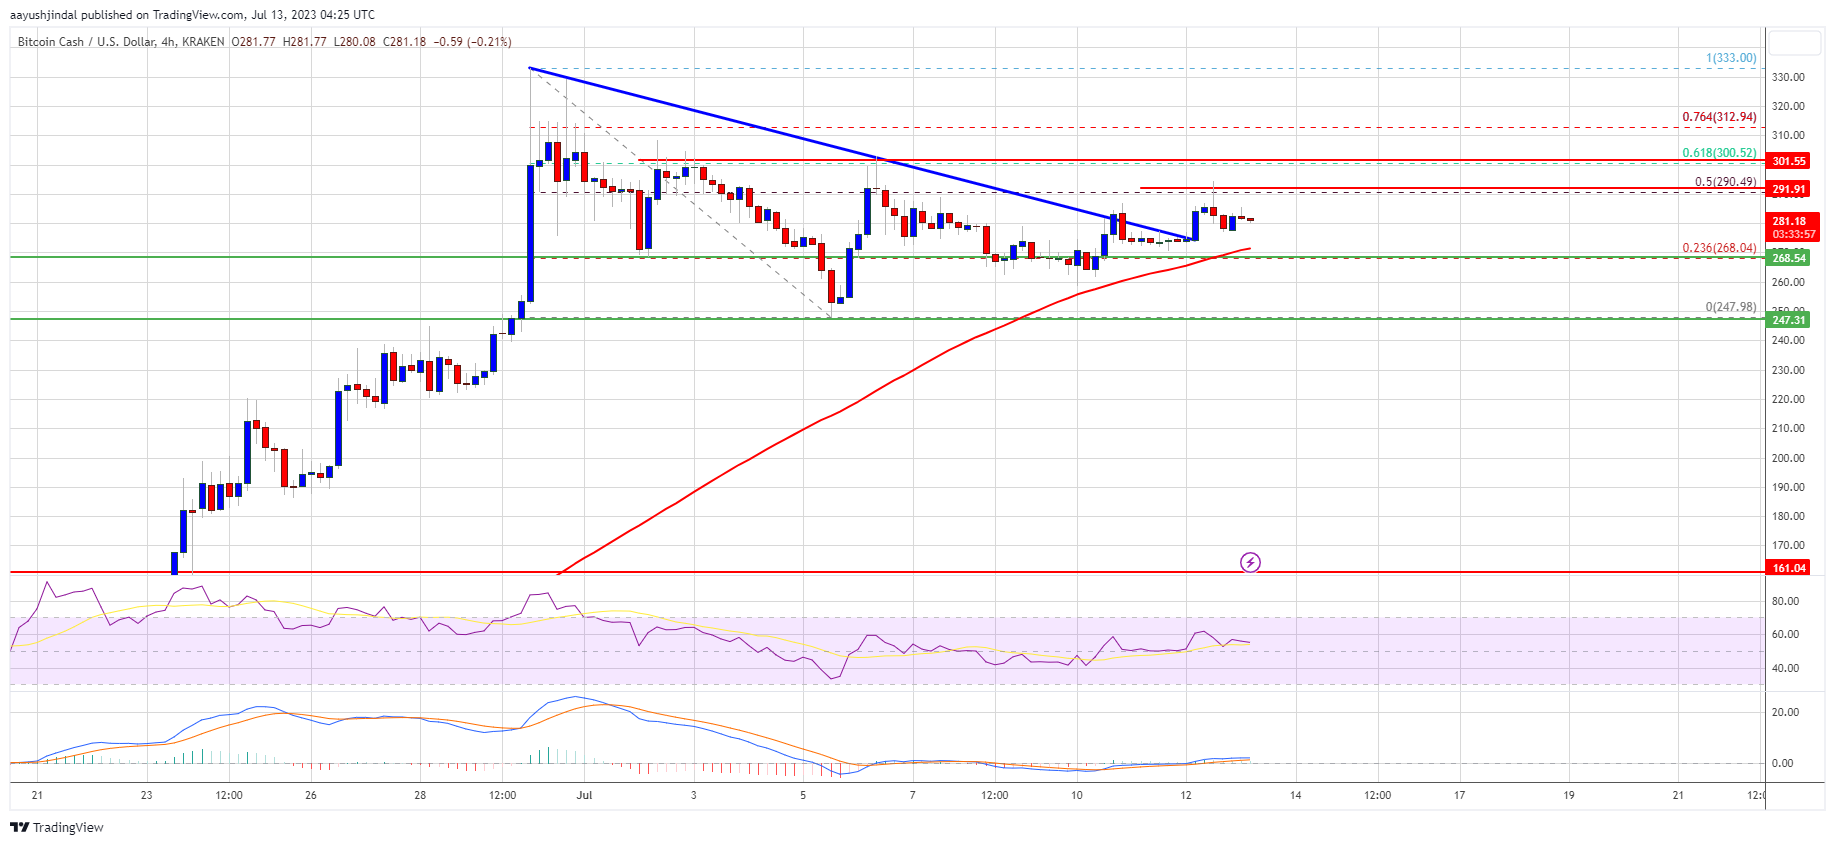
Source: BCH/USD on TradingView.com
The next major resistance is near $300 or the 61.8% Fib retracement level of the downward move from the $333 high to the $248 low. Any further gains could lead the price toward the $330 and $335 resistance levels in the near term. The next major hurdle is near the $350 level.
Dips Supported in BCH?
If Bitcoin Cash price fails to clear the $300 resistance, it could start a fresh decline. Initial support on the downside is near the $268 level or the 100 simple moving average (4 hours).
The next major support is near the $250 level, where the bulls are likely to appear. If the price fails to stay above the $250 support, the price could test the $225 support. Any further losses could lead the price toward the $200 handle in the near term.
Technical indicators
4-hour MACD – The MACD for BCH/USD is losing pace in the bullish zone.
4-hour RSI (Relative Strength Index) – The RSI is currently above the 50 level.
Key Support Levels – $268 and $250.
Key Resistance Levels – $290 and $300.


