

- There was a strong decline in bitcoin price below the $5,280 support level against the US Dollar.
- The price even spiked below the $5,000 support level and it is currently consolidating above $5,100.
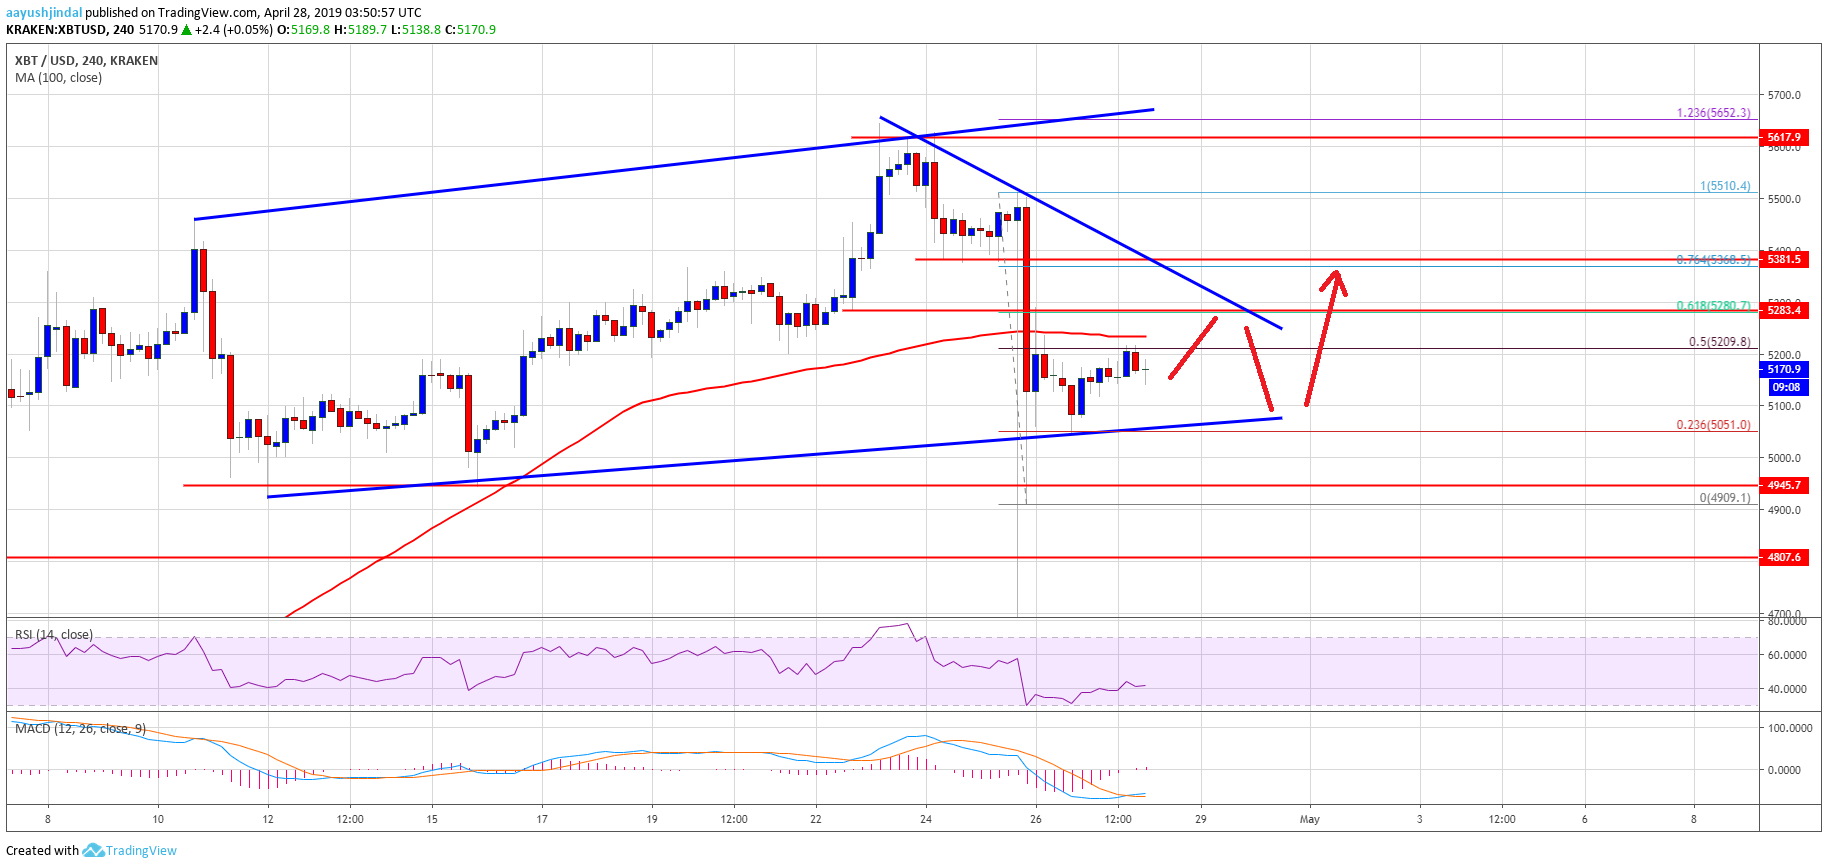
- There is a major bullish trend line in place with support at $5,080 on the 4-hours chart of the BTC/USD pair (data feed from Kraken).
- The pair could bounce back as long as there is no weekly close below the $5,000 support level.
Bitcoin price started consolidating losses after a strong decline against the US Dollar. BTC is likely to recover above $5,200 and $5,280 in the near term unless the $5,000 gives way.
Bitcoin Price Weekly Analysis (BTC)
This past week, there was a significant rejection in bitcoin price near the $5,660 level against the US Dollar. The BTC/USD pair started a strong downward move below $5,400 after tether’s drama. The price tumbled below the key $5,280 and $5,200 support levels. There was even a spike below $5,000, plus a close below the 100 simple moving average (4-hours). A swing low was formed near the $4,910 level and recently the price recovered above $5,000 and $5,050.
At the moment, the price is testing the 50% Fib retracement level of the last drop from the $5,510 swing high to $4,910 swing low. However, the $5,220 area and the 100 simple moving average (4-hours) are acting as hurdles. Above $5,220, there is a major resistance near $5,280 and a connecting bearish trend line. The 61.8% Fib retracement level of the last drop from the $5,510 swing high to $4,910 swing low is also near the $5,280 level. A successful close above the $5,280 level might trigger a decent recovery in the near term.
On the downside, there is a major bullish trend line in place with support at $5,080 on the 4-hours chart of the BTC/USD pair. The trend line support near $5,080 is very important, below which the price could test $5,000. If there is a daily close below $5,000, the price is likely to move further into a bearish zone. In the mentioned case, the price will most likely test $4,800 or $4,750.

Looking at the chart, bitcoin price faced a strong selling interest below $5,400. However, it managed to stay above the $5,000 support. Therefore, there are chances of a recovery above the $5,280 resistance levels. If there is a close above $5,280, there are chances of move towards $5,400 or even $5,500.
Technical indicators
4 hours MACD – The MACD for BTC/USD is slowly moving into the bullish zone.
4 hours RSI (Relative Strength Index) – The RSI for BTC/USD is back above the 40 level, with a few positive signs.
Major Support Level – $5,050
Major Resistance Level – $5,280