

- The price retested the $5,360 resistance and it looks set to trade further higher in the near term.
- There was a break above a short term contracting triangle with resistance at $5,155 on the hourly chart of the BTC/USD pair (data feed from Kraken).
- The pair is likely to surge towards $5,500 or even $5,600 once it successfully clear the $5,360 resistance.
Bitcoin price is climbing higher towards key resistances against the US Dollar. BTC could accelerate gains along with Ethereum once it clears the $5,360 resistance area.
Bitcoin Price Analysis
Recently, we saw a downside correction towards the $4,800 support in bitcoin price against the US Dollar. The BTC/USD pair tested the $4,750 support and later recovered above $4,800 and $4,900. It slowly recovered and climbed above the $5,000 resistance and the 100 hourly simple moving average. Finally, a solid support base was formed near the $5,000 level before the price traded above the $5,120 and $5,200 resistance levels.
During the rise, there was a break above a short term contracting triangle with resistance at $5,155 on the hourly chart of the BTC/USD pair. The pair even traded above the $5,300 level and retested the key $5,360 resistance area. It is currently consolidating gains below the $5,360 resistance. An initial support is near the 23.6% Fib retracement level of the recent wave from the $4,903 low to $5,359 high.
However, the main support is near the $5,200 level. If there is an extended downside correction, the price could test the $5,120 support area. Besides, the 50% Fib retracement level of the recent wave from the $4,903 low to $5,359 high is near the $5,130 level to act as a support. To the topside, the $5,360 level is a strong resistance. A clear break above the $5,360 resistance is likely to start a solid upward move towards the $5,400 and $5,500 resistance levels.
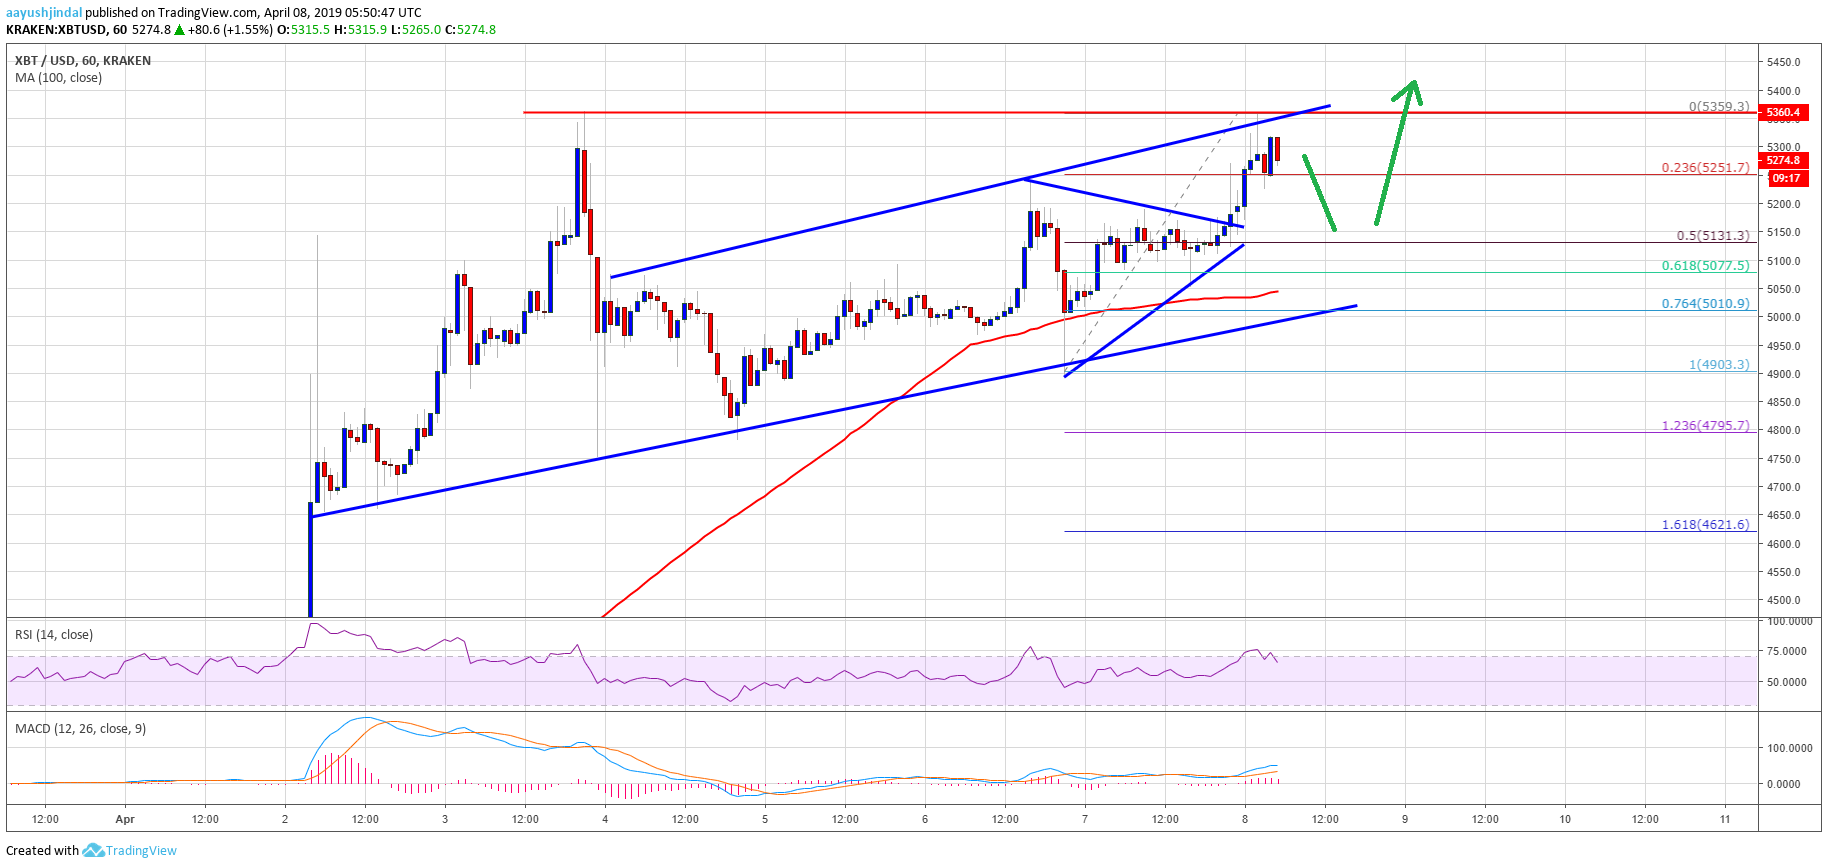

Looking at the chart, bitcoin price seems to be preparing for a fresh increase above the $5,360 resistance. The main target for buyers this week could be $5,500 or $5,600. Conversely, if there is a downside correction, the $5,200 and $5,120 levels may act as a supports. The main support is at $5,000 and the 100 hourly SMA. A daily close below $5,000 might push the price back towards the $4,800 or $4,750 support area.
Technical indicators:
Hourly MACD – The MACD is placed nicely in the bullish zone.
Hourly RSI (Relative Strength Index) – The RSI for BTC/USD tested the 75 level and it is currently correcting lower.
Major Support Levels – $5,200 followed by $5,120.
Major Resistance Levels – $5,360, $5,400 and $5,500.