

- Bitcoin price rebounded above $5,100 after a massive drop towards $4,900 against the US Dollar.
- The price seems to be facing a strong resistance near the $5,200 and $5,220 levels.
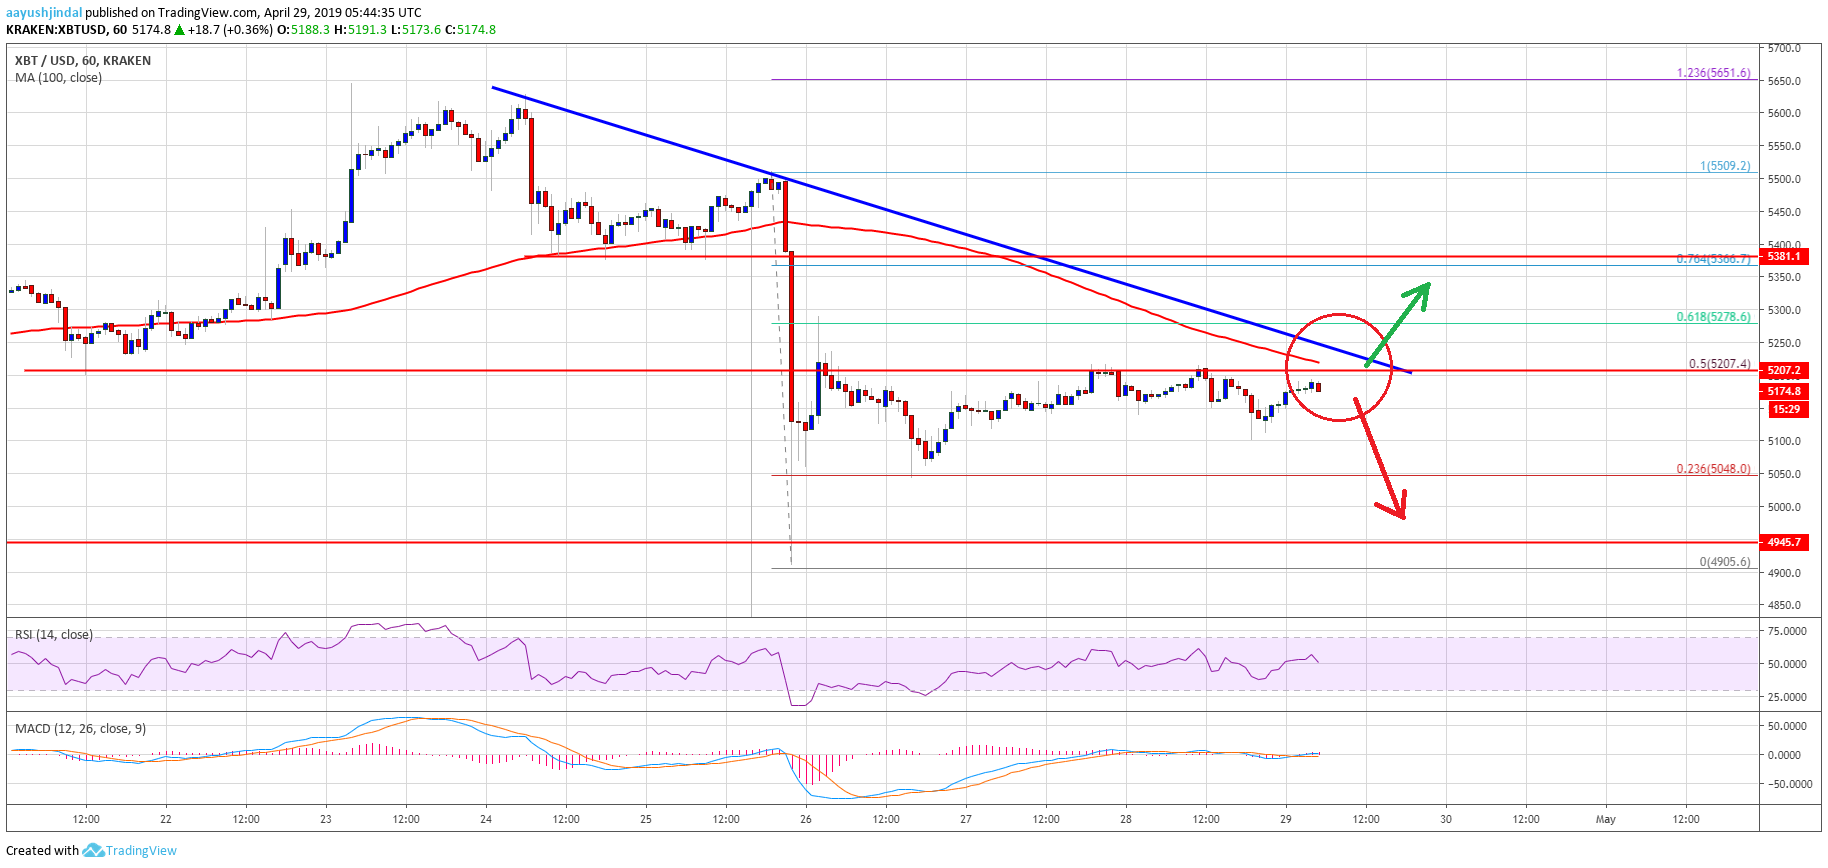
- There is a major bearish trend line in place with resistance near $5,230 on the hourly chart of the BTC/USD pair (data feed from Kraken).
- The pair could either rally above the $5,250 resistance or start a fresh decline in the near term.
Bitcoin price is facing a significant resistance against the US Dollar. BTC is likely to climb sharply if it settles above $5,250 and the 100 hourly simple moving average.
Bitcoin Price Analysis
This past week, there was a sharp drop in bitcoin price below the $5,200 support against the US Dollar. The BTC/USD pair even spiked below the $5,000 support level and formed a swing low above $4,900. Later, the price started a slow and steady recovery above the $5,000 and $5,050 resistance levels. The bulls even pushed the price above the $5,100 resistance and the 23.6% Fib retracement level of the last slide from the $5,509 high to $4,905 low.
It opened the doors for more gains above the $5,150 level, but the price struggled to clear the $5,200 and $5,220 resistance levels. It seems like the 50% Fib retracement level of the last slide from the $5,509 high to $4,905 low is acting as a hurdle. Besides, the 100 hourly simple moving average is also acting as a key resistance near $5,220. More importantly, there is a major bearish trend line forming with resistance near $5,230 on the hourly chart of the BTC/USD pair.
Therefore, the price must break the $5,220 resistance, the trend line, and the 100 hourly SMA. A successful close above $5,250 is likely to start a decent upward move towards the $5,300 level. The next major resistance for the bulls is near the $5,380 level. On the other hand, if there is no upside break, the price may decline below $5,150. An initial support is near the $5,100 level, below which the next stop could be $5,050.

Looking at the chart, bitcoin price is clearly trading near a crucial juncture below $5,220 and $5,250. If the bulls gain control above $5,220 and $5,250, there could be a decent extension towards the $5,380 resistance level. Conversely, a continuous struggle to clear $5,250 is likely to start a fresh decrease towards the $5,100 or $5,050 level in the near term.
Technical indicators:
Hourly MACD – The MACD is slowly moving in the bullish zone, with a few positive signs.
Hourly RSI (Relative Strength Index) – The RSI for BTC/USD managed to move back above the 50 level.
Major Support Levels – $5,150 followed by $5,100.
Major Resistance Levels – $5,200, $5,220 and $5,250.