
Reason to trust
How Our News is Made
Strict editorial policy that focuses on accuracy, relevance, and impartiality
Ad discliamer
Morbi pretium leo et nisl aliquam mollis. Quisque arcu lorem, ultricies quis pellentesque nec, ullamcorper eu odio.
- Bitcoin price gained a strong bullish momentum and broke the key $8,300 resistance against the US Dollar.
- The price surged more than 10% and broke the $8,500 and $8,800 resistance levels.
- There was a break above a major triangle resistance near $8,020 on the hourly chart of the BTC/USD pair (data feed from Kraken).
- The pair traded close to the $9,000 level and it is currently correcting lower towards key supports.
Bitcoin price rallied significantly after it broke $8,300 against the US Dollar. BTC is currently correcting gains, but it is likely to find support near $8,600 or $8,500.
Bitcoin Price Analysis
After forming a support base above the $7,800 and $7,900 levels, bitcoin price rallied significantly against the US Dollar. The BTC/USD pair surged above key resistance near $8,000 and $8,200 to move into a bullish zone. Moreover, there was a close above the $8,200 resistance and the 100 hourly simple moving average. It opened the doors for more gains above the $8,400 and $8,500 resistance levels.
During the rise, there was a break above a major triangle resistance near $8,020 on the hourly chart of the BTC/USD pair. The pair gained traction and traded towards the $9,000 barrier. A new 2019 high was formed at $8,955 and the price is currently correcting lower. It is testing the 23.6% Fib retracement level of the upward move from the $7,912 low to $8,955 high. If it extends the correction, it is likely to find a strong support near the $8,600 level. Below $8,600, the main supports are $8,500 and $8,440.
Besides, the 50% Fib retracement level of the upward move from the $7,912 low to $8,955 high is near the $8,435 level to hold losses. If there is an extended decline, the price could find bids near the $8,300 level. The stated $8,300 level was a resistance earlier and now it is likely to act as major buy zone.
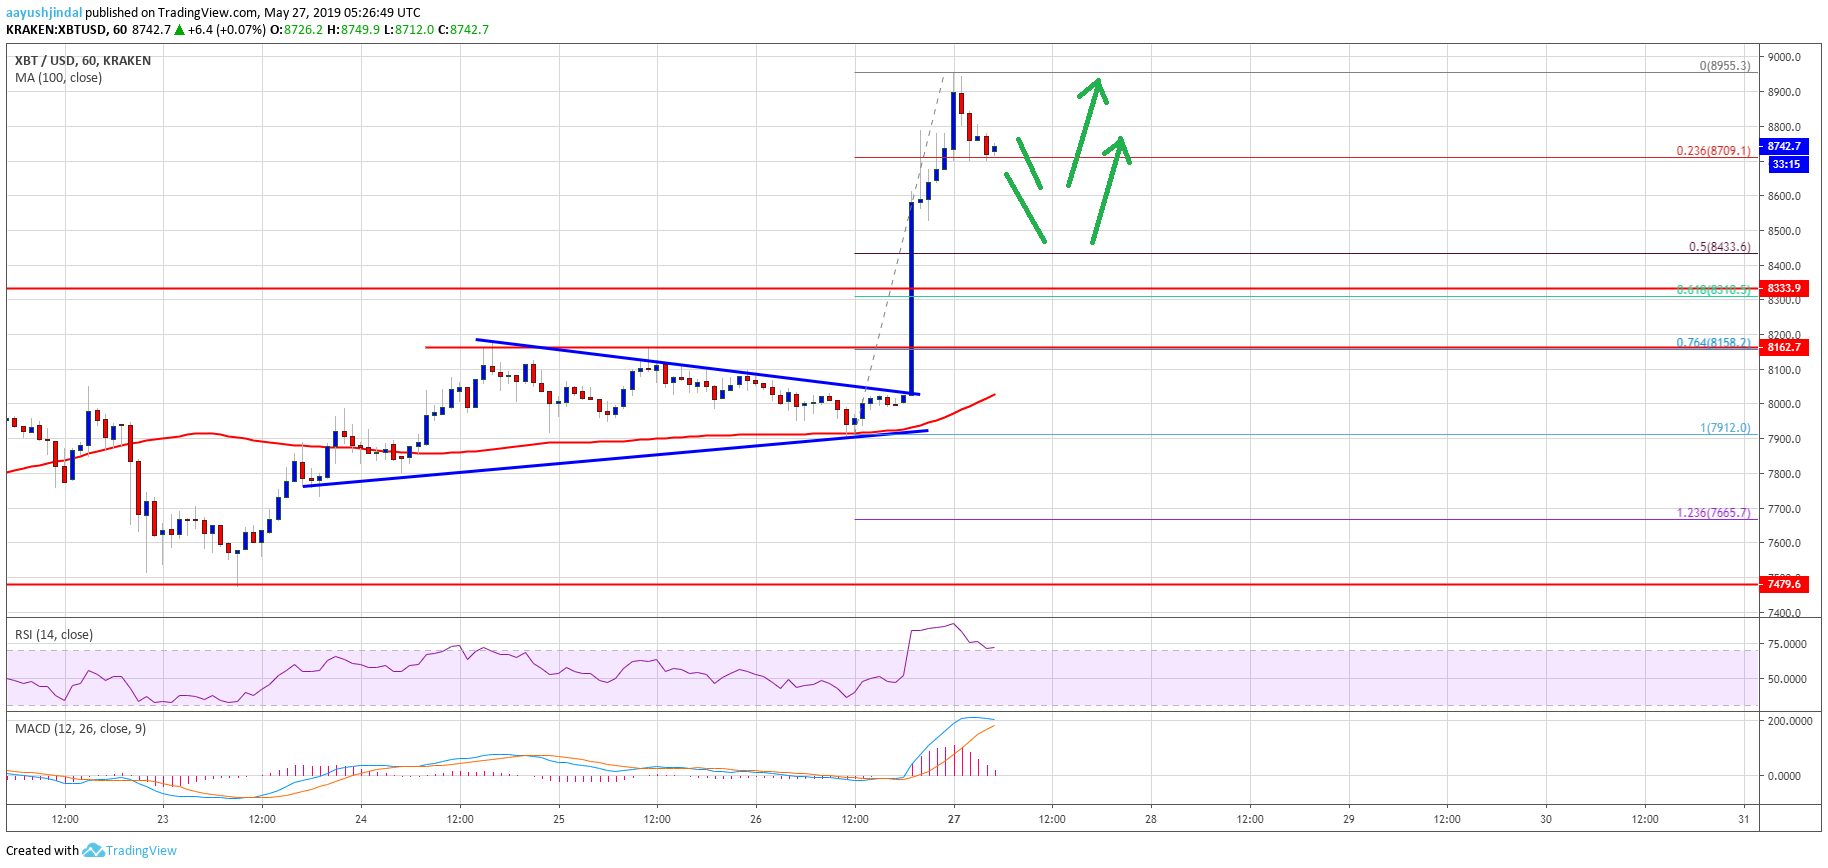
Looking at the chart, bitcoin price clearly made a nice upward move above the $8,300 and $8,500 resistances. It almost tested the $9,000 level and currently correcting gains. However, there are many supports on the downside near the $8,600 and $8,500. On the upside, an initial resistance is near the $8,800 level, followed by $8,850. The main hurdle is near the $9,000 level, above which the bulls could aim the $9,280 and $9,500 levels in the coming sessions.
Technical indicators:
Hourly MACD – The MACD is currently showing a lot of positive signs in the bullish zone.
Hourly RSI (Relative Strength Index) – The RSI for BTC/USD is currently correcting lower towards the 70 level.
Major Support Levels – $8,600 followed by $8,500.
Major Resistance Levels – $8,800, $8,900 and $9,000.


