
Reason to trust
How Our News is Made
Strict editorial policy that focuses on accuracy, relevance, and impartiality
Ad discliamer
Morbi pretium leo et nisl aliquam mollis. Quisque arcu lorem, ultricies quis pellentesque nec, ullamcorper eu odio.
- Bitcoin price started an upside correction from the $8,674 swing low against the US Dollar.
- The price is up around 3%, but it is facing hurdles near the $9,100 and $9,150 levels.
- There is a key bearish trend line forming with resistance near $9,100 on the hourly chart of the BTC/USD pair (data feed from Kraken).
- On the downside, there is a decent support forming near the $8,860 levels.
Bitcoin price is currently correcting higher above $8,800 against the US Dollar. However, BTC is still facing a couple of key hurdles near $9,100 and $9,150.
Bitcoin Price Analysis
After a major decline, bitcoin found support near the $8,670 level against the US Dollar. A new monthly low was formed near $8,674 before the price started an upside correction.
The price recovered above the $8,800 and $8,900 levels. Moreover, there was a break above the $9,000 resistance area and the 100 hourly simple moving average. The bulls were able to gain strength, but they faced a strong selling interest near the $9,150 and $9,160 levels.
A high was formed near $9,146 and the price is currently retreating from the high. It broke the $9,000 support area and the 100 hourly SMA. Additionally, there was a break below the 23.6% Fib retracement level of the recent wave from the $8,674 low to $9,146 high.
An immediate support on the downside is near the $8,900 level. It represents the 50% Fib retracement level of the recent wave from the $8,674 low to $9,146 high. The main support is near the $8,860 and $8,840 levels.
More importantly, there is a connecting bullish trend line forming with support near $8,840 on the hourly chart of the BTC/USD pair. Finally, the 61.8% Fib retracement level of the recent wave from the $8,674 low to $9,146 high is near $8,854.
Therefore, a downside break below the $8,840 level might restart the decline in bitcoin. The next key support is near the $8,700 area, below which the price could revisit the $8,500 level.
On the upside, the price is facing hurdles near the $9,100 and $9,150 levels. Besides, there is a key bearish trend line forming with resistance near $9,100 on the same chart.
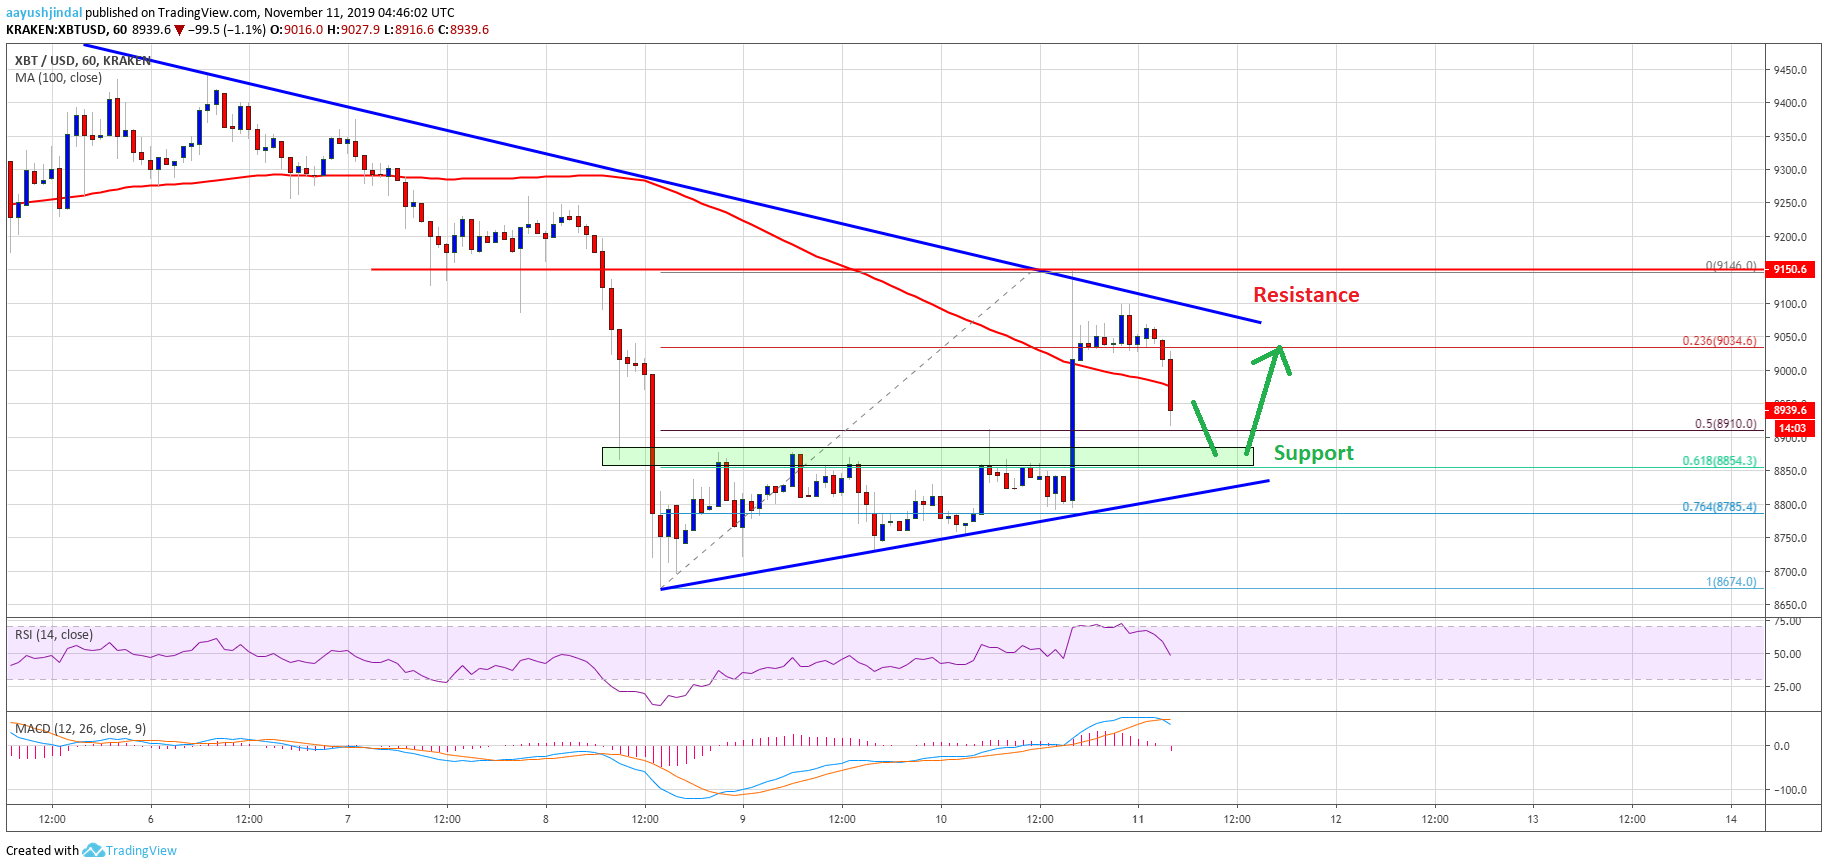
Looking at the chart, bitcoin seems to be struggling to continue above $9,100. If it continues to struggle, there is a risk of another bearish wave below the $8,800 level in the near term.
Technical indicators:
Hourly MACD – The MACD is currently moving back into the bearish zone.
Hourly RSI (Relative Strength Index) – The RSI for BTC/USD is currently declining and approaching the 50 level.
Major Support Levels – $8,900 followed by $8,840.
Major Resistance Levels – $9,100, $9,150 and $9,300.