
Reason to trust
How Our News is Made
Strict editorial policy that focuses on accuracy, relevance, and impartiality
Ad discliamer
Morbi pretium leo et nisl aliquam mollis. Quisque arcu lorem, ultricies quis pellentesque nec, ullamcorper eu odio.
- After a strong recovery, bitcoin price struggled to gain momentum above $12,000 against the US Dollar.
- The price topped near the $12,050 level and recently corrected gains below $11,500.
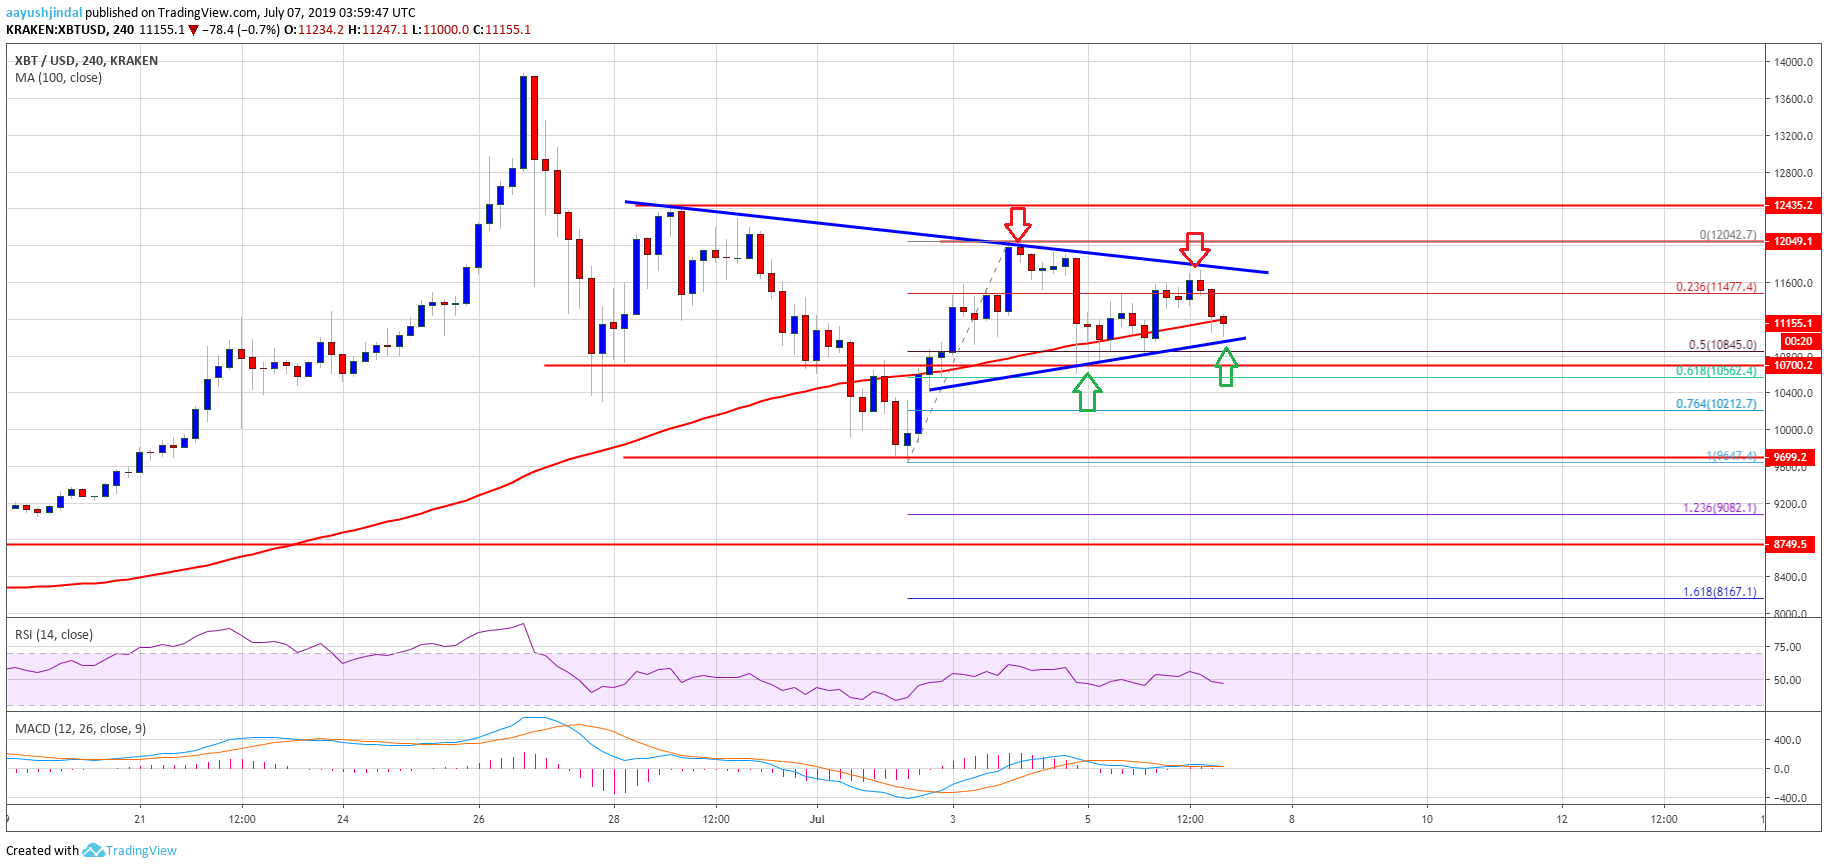
- There is a major bearish trend line forming with resistance near $11,700 on the 4-hours chart of the BTC/USD pair (data feed from Kraken).
- The pair could either surpass $11,700 and $12,000 or decline further below the $10,800 support.
Bitcoin price is facing a couple of strong resistances near $11,700 and $12,000 against the US Dollar. BTC must surpass the $12,000 barrier to continue higher towards the $13,000 level.
Bitcoin Price Weekly Analysis (BTC)
This past week, bitcoin price started a strong recovery from the $9,700 swing support against the US Dollar. The BTC/USD pair climbed above the $10,500 and $11,000 resistance levels. The upward move was very positive since the price surpassed the $11,200 and $11,500 resistance levels. Finally, the price broke the $11,800 resistance and the 100 simple moving average (4-hours).
Finally, there was a break above the $12,000 resistance level, but the price failed to continue higher. A swing high was formed near $12,050 and the price recently corrected lower. It trimmed gains and declined below the $11,500 support level. Moreover, there was a break below the 23.6% Fib retracement level of the upward move from the $9,650 swing low to $12,050 swing high. The decline was such that the price spiked below the $11,000 support level.
However, the $10,800 level acted as a strong support. Additionally, bitcoin stayed above the 50% Fib retracement level of the upward move from the $9,650 swing low to $12,050 swing high. At the moment, the price is consolidating near the $11,200 level and the 100 simple moving average (4-hours). On the upside, there is a major bearish trend line forming with resistance near $11,700 on the 4-hours chart of the BTC/USD pair.
If there is an upside break above the $11,700 resistance zone, there are chances of a fresh increase. The next immediate resistance is near the $12,000 level, above which the price could accelerate towards the $12,500 and $12,800 level. On the downside, there is a connecting bullish trend line forming with support near $11,000 on the same chart. However, the main support is near the $10,800 level, below which there could be strong losses.
Looking at the chart, bitcoin price is clearly preparing for the next break either above $12,000 or below $10,800. As long as the price is above $11,000 and $10,800, there are chances of an upside extension above $12,000.
Technical indicators
4 hours MACD – The MACD for BTC/USD is slowly moving back in the bearish zone.
4 hours RSI (Relative Strength Index) – The RSI for BTC/USD is currently just below the 50 level.
Major Support Level – $10.800
Major Resistance Level – $12,000