

- Bitcoin price is struggling to correct above the $8,350 and $8,400 resistances against the US Dollar.
- The price is currently correcting higher after trading as low as $8,146.
- Recently, there was a break below a key ascending channel with support near $8,340 on the hourly chart of the BTC/USD pair (data feed from Kraken).
- The price could correct higher, but it is likely to face a strong resistance near $8,350 and $8,400.
Bitcoin price is trading in a negative zone below $8,400 against the US Dollar. BTC must climb above $8,400 and $8,500 to move back into a positive zone.
Bitcoin Price Analysis
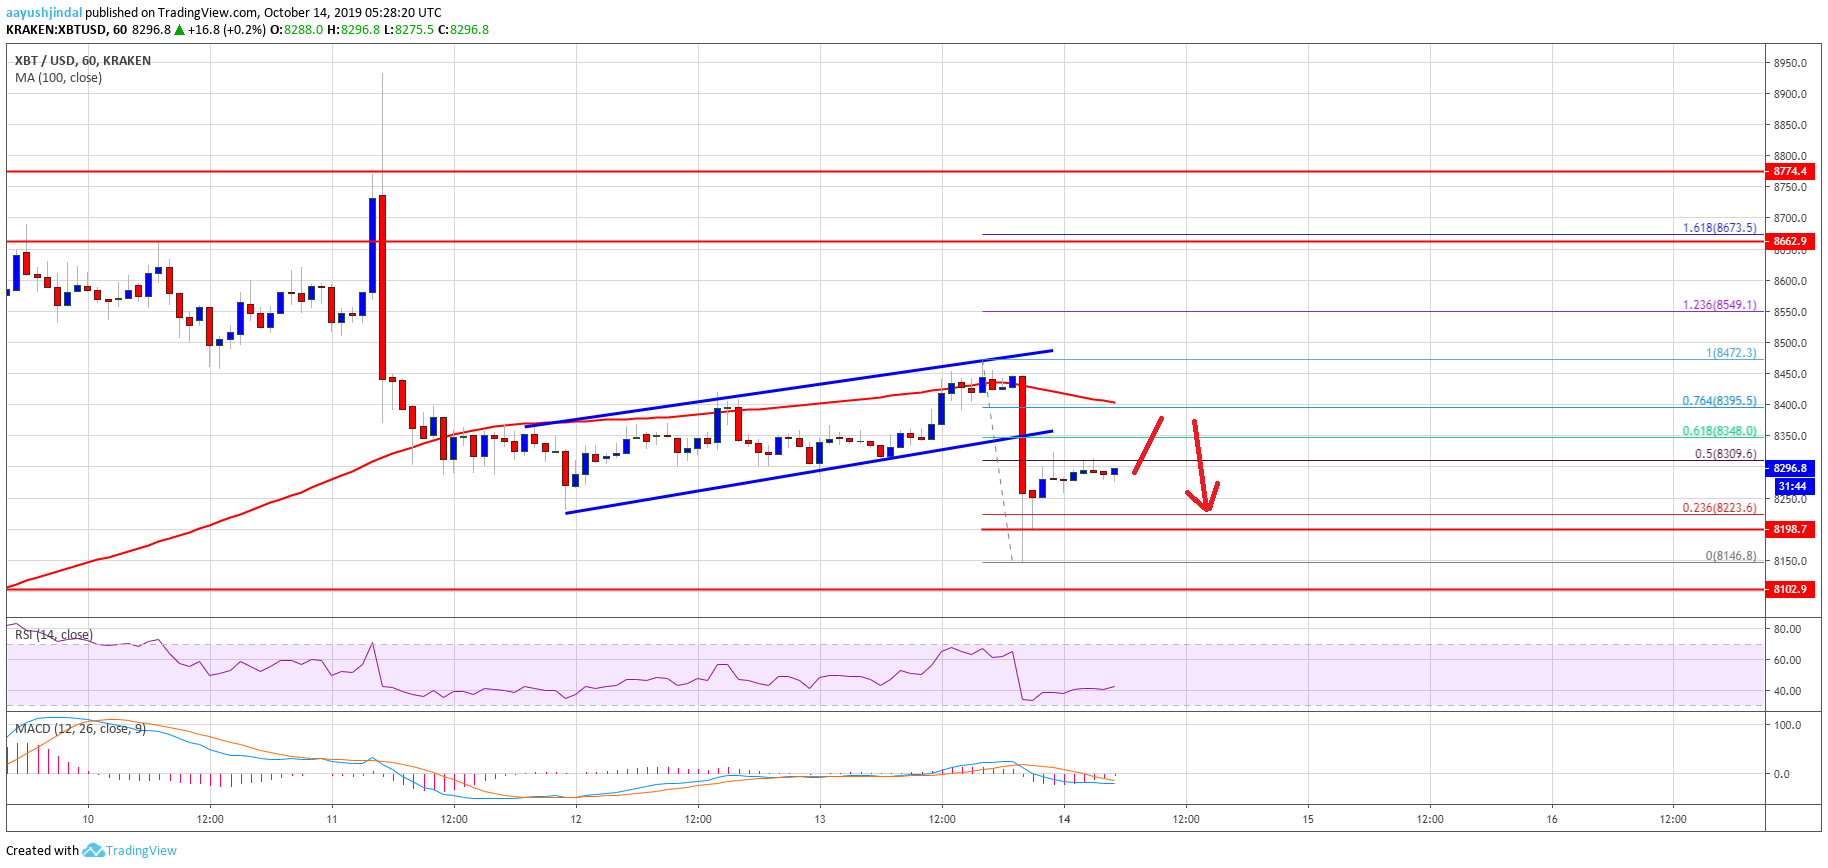
This past week, we saw a nasty decline from the $8,950 zone in bitcoin against the US Dollar. The price declined heavily and broke the key $8,500 support area. Moreover, there was a close below the $8,500 level and the 100 hourly simple moving average. It opened the doors for more losses below the $8,400 and $8,350 support levels. Recently, there was a recovery above the $8,400 level, but the price failed to gain pace above $8,450.
As a result, there was a fresh decline from the $8,472 high. During the decline, there was a break below a key ascending channel with support near $8,340 on the hourly chart of the BTC/USD pair. The pair traded as low as $8,146 and it is currently correcting higher. It broke the $8,200 level and the 23.6% Fib retracement level of the recent decline from the $8,472 high to $8,146 low.
At the moment, the price is testing the $8,300 area. Besides, it seems like the 50% Fib retracement level of the recent decline from the $8,472 high to $8,146 low is acting as a resistance. On the upside, there are many hurdles forming near the $8,350 and $8,400 levels. The key resistance is near the $8,400 level and the 100 hourly SMA. It also coincides with the 76.4% Fib retracement level of the recent decline from the $8,472 high to $8,146 low.
Therefore, a clear close above the $8,400 level might start a decent recovery. The next key resistance is near the $8,500 level, above which the price could test the $8,800 resistance. Conversely, if the price fails to recover above $8,350 or $8,400, it could resume its decline. An immediate support is near the $8,200 level.
Looking at the chart, bitcoin is clearly trading in a bearish zone below $8,400 and the 100 hourly SMA. In the short term, there could be an upside correction, but a break above $8,400 won’t be easy.
Technical indicators:
Hourly MACD – The MACD is currently losing momentum in the bearish zone.
Hourly RSI (Relative Strength Index) – The RSI for BTC/USD is slowly climbing towards the 50 level.
Major Support Levels – $8,200 followed by $8,150.
Major Resistance Levels – $8,350, $8,400 and $8,500.