Reason to trust
How Our News is Made
Strict editorial policy that focuses on accuracy, relevance, and impartiality
Ad discliamer
Morbi pretium leo et nisl aliquam mollis. Quisque arcu lorem, ultricies quis pellentesque nec, ullamcorper eu odio.
- Bitcoin price struggled to climb above the $3,990 and $4,000 resistance levels against the US Dollar.
- The price declined again and retested the key $3,940 support area and the 100 hourly SMA.
- There is a short term bearish trend line in place with resistance at $3,980 on the hourly chart of the BTC/USD pair (data feed from Kraken).
- Buyers might have the last chance for an upside break above the $4,000 resistance.
Bitcoin price is holding an important support near $3,940 against the US Dollar. BTC is likely to make the next move either above $4,000 or below the $3,900 support level.
Bitcoin Price Analysis
Yesterday, we saw the start of a downside correction in bitcoin price from the $4,041 high against the US Dollar. The BTC/USD pair corrected lower and traded below the $4,020 and $4,000 support levels. There was a break below the 23.6% Fib retracement level of the last wave from the $3,846 low to $4,041 high. Besides, there was a close below the $4,000 support and the price tested the $3,940 support area.
More importantly, the 50% Fib retracement level of the last wave from the $3,846 low to $4,041 high acted as a strong support. Sellers made two attempts to clear the $3,940 support, but they failed to gain strength. Similarly, buyers pushed the price above the $3,980 level, but they struggled to keep the price in a positive zone. The price was recently rejected near the $3,980 level. It is currently moving lower and it could retest the $3,940 support area.
It seems like buyers might have the last chance for an upside break above the $4,000 resistance. There is also a short term bearish trend line in place with resistance at $3,980 on the hourly chart of the BTC/USD pair. Therefore, buyers need to clear the trend line and the $4,000 resistance for a fresh upward move. If they fail, there could be a strong decline below the $3,940 support area. Besides, a close below the $3,940 support and the 100 hourly SMA could push the price towards the $3,900 or $3,880 support.
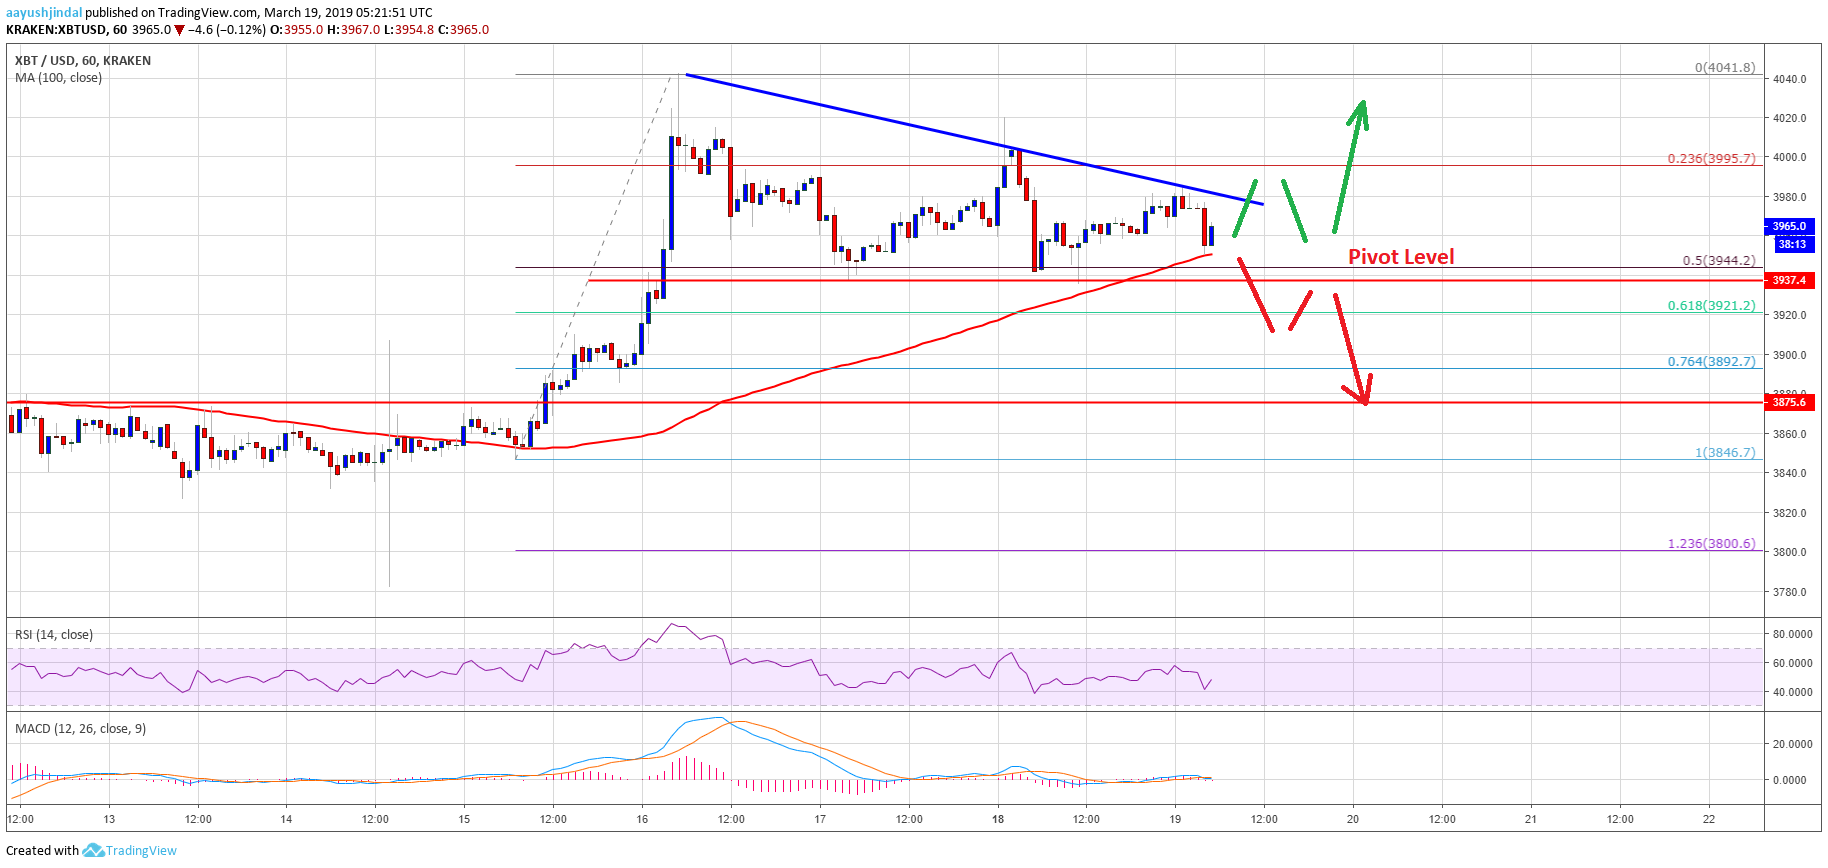
Looking at the chart, bitcoin price is clearly approaching the next break either above the $4,000 resistance or below the $3,940 support. As long as the price is above the 100 hourly SMA, there are chances of an upside break above $4,000. The next key resistance is at $4,040, followed by $4,100.
Technical indicators:
Hourly MACD – The MACD is slowly moving into the bullish zone.
Hourly RSI (Relative Strength Index) – The RSI for BTC/USD recently tested the 40 level and it is currently moving towards 50.
Major Support Levels – $3,940 followed by $3,900.
Major Resistance Levels – $3,980, $4,000 and $4,040.