

Bitcoin might be starting a strong bullish wave above $7,500 against the US Dollar. However, BTC bulls must be careful considering a cluster of resistances between $7,700 and $8,000.
- Bitcoin price is gaining traction above the $7,400 and $7,500 resistance levels against the US Dollar.
- There are many hurdles on the upside, starting with $7,640 and up to $8,000.
- There is a connecting bullish trend line forming with support near $7,360 on the hourly chart of the BTC/USD pair (data feed from Kraken).
- A continuous failure near $7,700 and $7,800 could spark another bearish wave.
Bitcoin Price Approaching Resistance
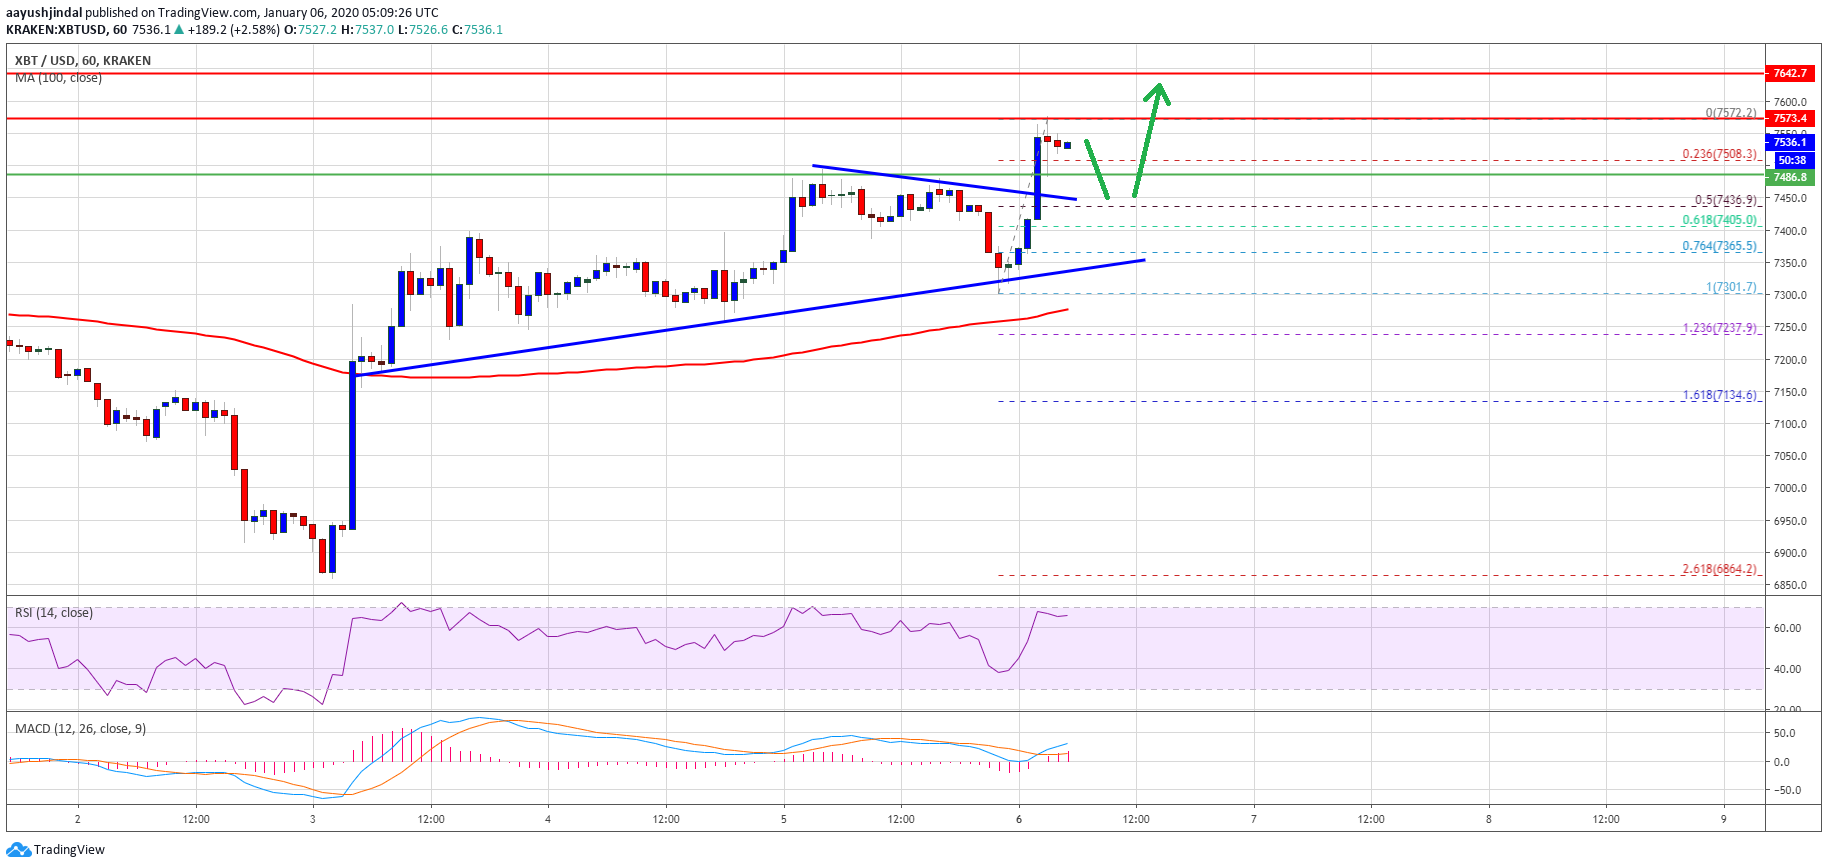
In the past few sessions, there was a decent increase in bitcoin above the $7.300 resistance against the US Dollar. Moreover, BTC settled above the $7,400 level and the 100 hourly simple moving average.
Recently, there was a break above a short term bearish trend line with resistance near $7,455 on the hourly chart. It opened the doors for more gains above the $7,500 resistance.
The price traded to a new 2020 high at $7,572 and it is currently correcting lower. An initial support on the downside is near the $7,500 level. Besides, the 23.6% Fib retracement level of the recent rise from the $7,301 low to $7,572 high is also near the $7,500 area.
On the upside, an immediate resistance for bitcoin is near $7,580 and $7,600. The first key resistance is near the $7,640 level. More importantly, there is a cluster of hurdles between the $7,700 and $8,000 levels.
Therefore, the bulls need to be careful as the price approaches the key $8,000 barrier. If there is a successful break above the $8,000 resistance, the price could surge towards $8,500 and $8,800.
What if BTC Fails Near $7,700 and $7,800?
As mentioned, there are many hurdles between $7,700 and $8,000. So, it’s hard to discard chances of a bearish reaction below $7,500 and $7,450.
The first main support is near the $7,400 level, followed by a connecting bullish trend line near $7,360 on the same chart. If the bears succeed in pushing the price below the trend line, there is a risk of a larger pullback towards the $7,200 support area.
Looking at the chart, bitcoin price is rising steadily towards many barriers on the upside, starting with $7,640. If the bulls remain in action, we are likely to witness a break above $8,000. If not, the price might revisit $7,200.
Technical indicators:
Hourly MACD – The MACD is currently losing momentum in the bullish zone.
Hourly RSI (Relative Strength Index) – The RSI for BTC/USD is correcting lower towards the 50 level.
Major Support Levels – $7,450 followed by $7,360.
Major Resistance Levels – $7,580, $7,640 and $7,780.