

Key Points
- Bitcoin cash price extended losses and traded below the $400 level against the US Dollar.
- There are two key bearish trend lines in place with resistance at $420 and $450 on the hourly chart of the BCH/USD pair (data feed from Kraken).
- The pair remains at a risk of more losses below the $360 level in the near term.
Bitcoin cash price traded below the key $400 support against the US Dollar. BCH/USD could correct higher, but sellers are likely to appear near $420 or $450.
Bitcoin Cash Price Analysis
Yesterday, we discussed that bitcoin cash price could extend losses below $400 against the US Dollar. The BCH/USD pair corrected a few points recently, but it failed to break the $450 resistance. Later, there was a sharp downside move and the price declined below the $420 and $400 supports. A new low was formed at $360 and the price is now trading well below the 100 hourly simple moving average.
At the moment, the price is consolidating losses around the $380 level. It seems like the 23.6% Fib retracement level of the last slide from the $451 high to $360 low is acting as a resistance. Moreover, there are two key bearish trend lines in place with resistance at $420 and $450 on the hourly chart of the BCH/USD pair. The first bearish trend line coincides with the 50% Fib retracement level of the last slide from the $451 high to $360 low. Therefore, the $400-405 zone could prevent gains in the near term.
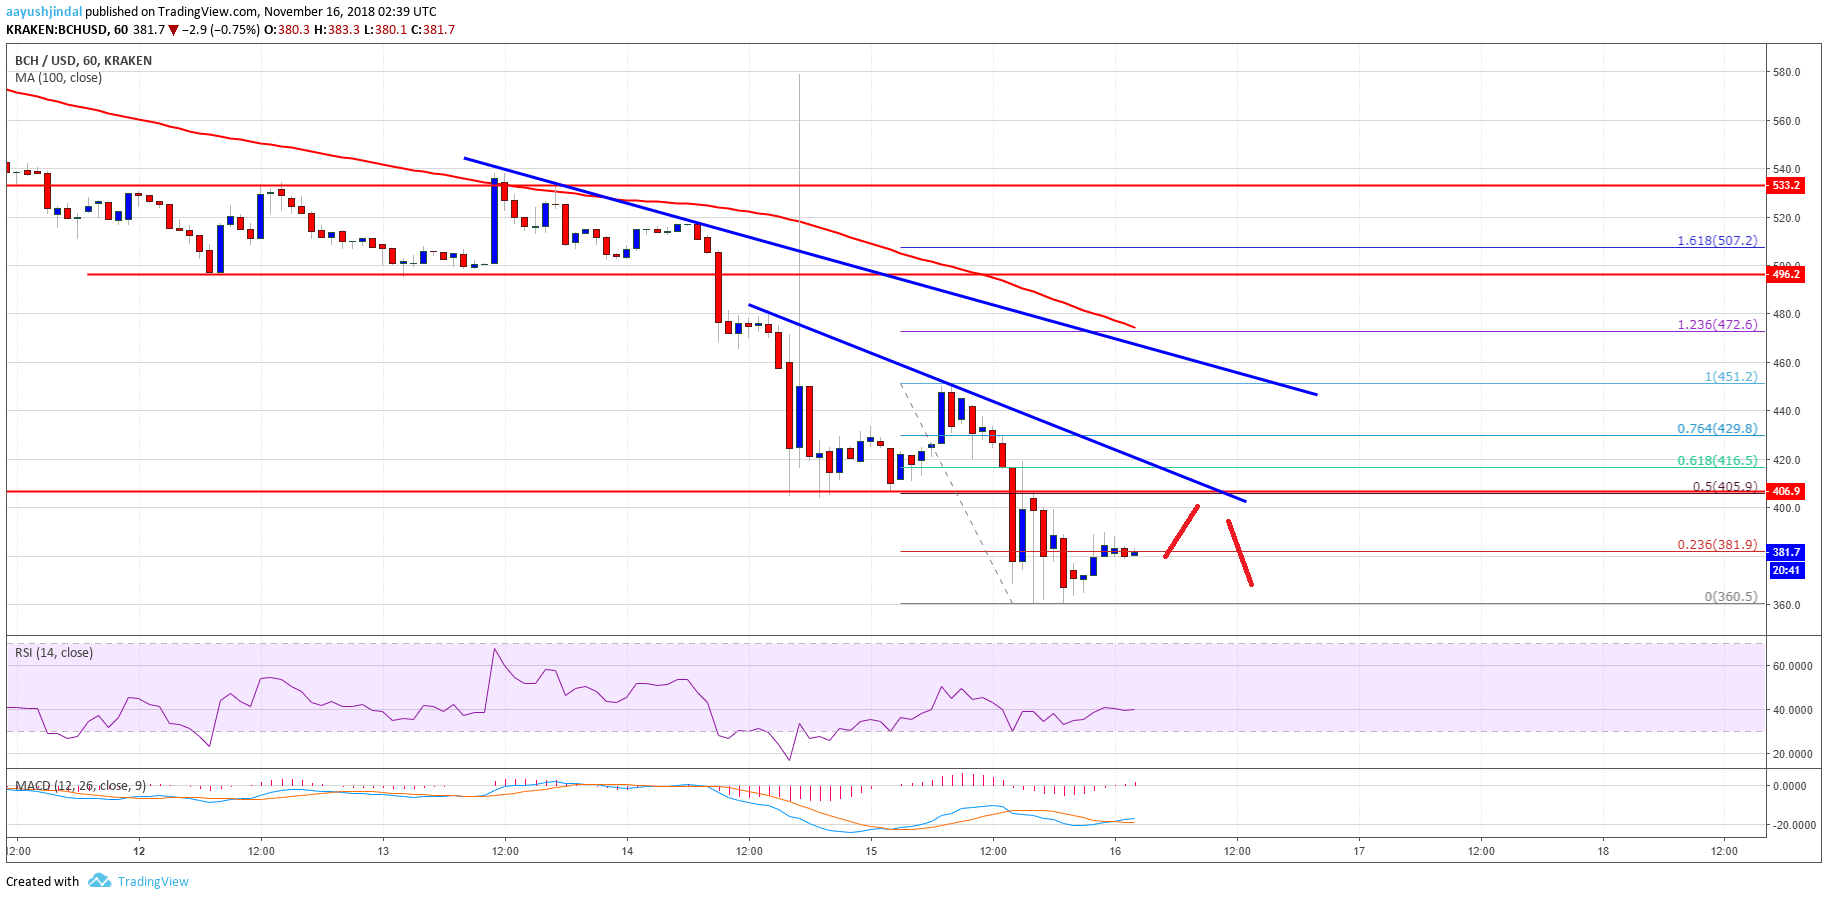

Looking at the chart, BCH price could correct a few points above $390. However, buyers are likely to struggle near $400, $405, $420 and finally $450. On the downside, the next target for sellers could be $350.
Looking at the technical indicators:
Hourly MACD – The MACD for BCH/USD is slightly placed in the bullish zone.
Hourly RSI (Relative Strength Index) – The RSI for BCH/USD is currently flat near the 40 level.
Major Support Level – $360
Major Resistance Level – $405