
Reason to trust
How Our News is Made
Strict editorial policy that focuses on accuracy, relevance, and impartiality
Ad discliamer
Morbi pretium leo et nisl aliquam mollis. Quisque arcu lorem, ultricies quis pellentesque nec, ullamcorper eu odio.
Key Points
- Bitcoin cash price declined further and broke a major support at $1,150 against the US Dollar.
- There is a major bearish trend line forming with resistance at $1,160 on the hourly chart of the BCH/USD pair (data feed from Kraken).
- The pair may perhaps continue to move down and it could even break the $1,100 support level.
Bitcoin cash price is accelerating declines below $1,200 against the US Dollar. BCH/USD is now well below $1,150 and eyes a downside break below $1,100.
Bitcoin Cash Price Resistance
There was no major upside recovery in bitcoin cash price above $1,220 against the US Dollar. The mentioned $1,220 level acted as a hurdle for buyers, resulting in more declines. The price declined further, settled below the $1,200 level, and broke the $1,150 support level. The recent downside break below $1,150 has opened the doors for more losses in the near term.
The decline was such that the price even broke the last swing low of $1,133. It is now well below $1,150 and the 100 hourly simple moving average. It seems like the price is heading towards the 1.236 Fib extension level of the last wave from the $1,133 low to $1,315 high at $1,090. It means the price may perhaps break the $1,100 support and accelerate declines towards $1,050. If sellers remain in control, the price might test the 1.618 Fib extension level of the last wave from the $1,133 low to $1,315 high. On the upside, there is a major bearish trend line forming with resistance at $1,160 on the hourly chart of the BCH/USD pair.
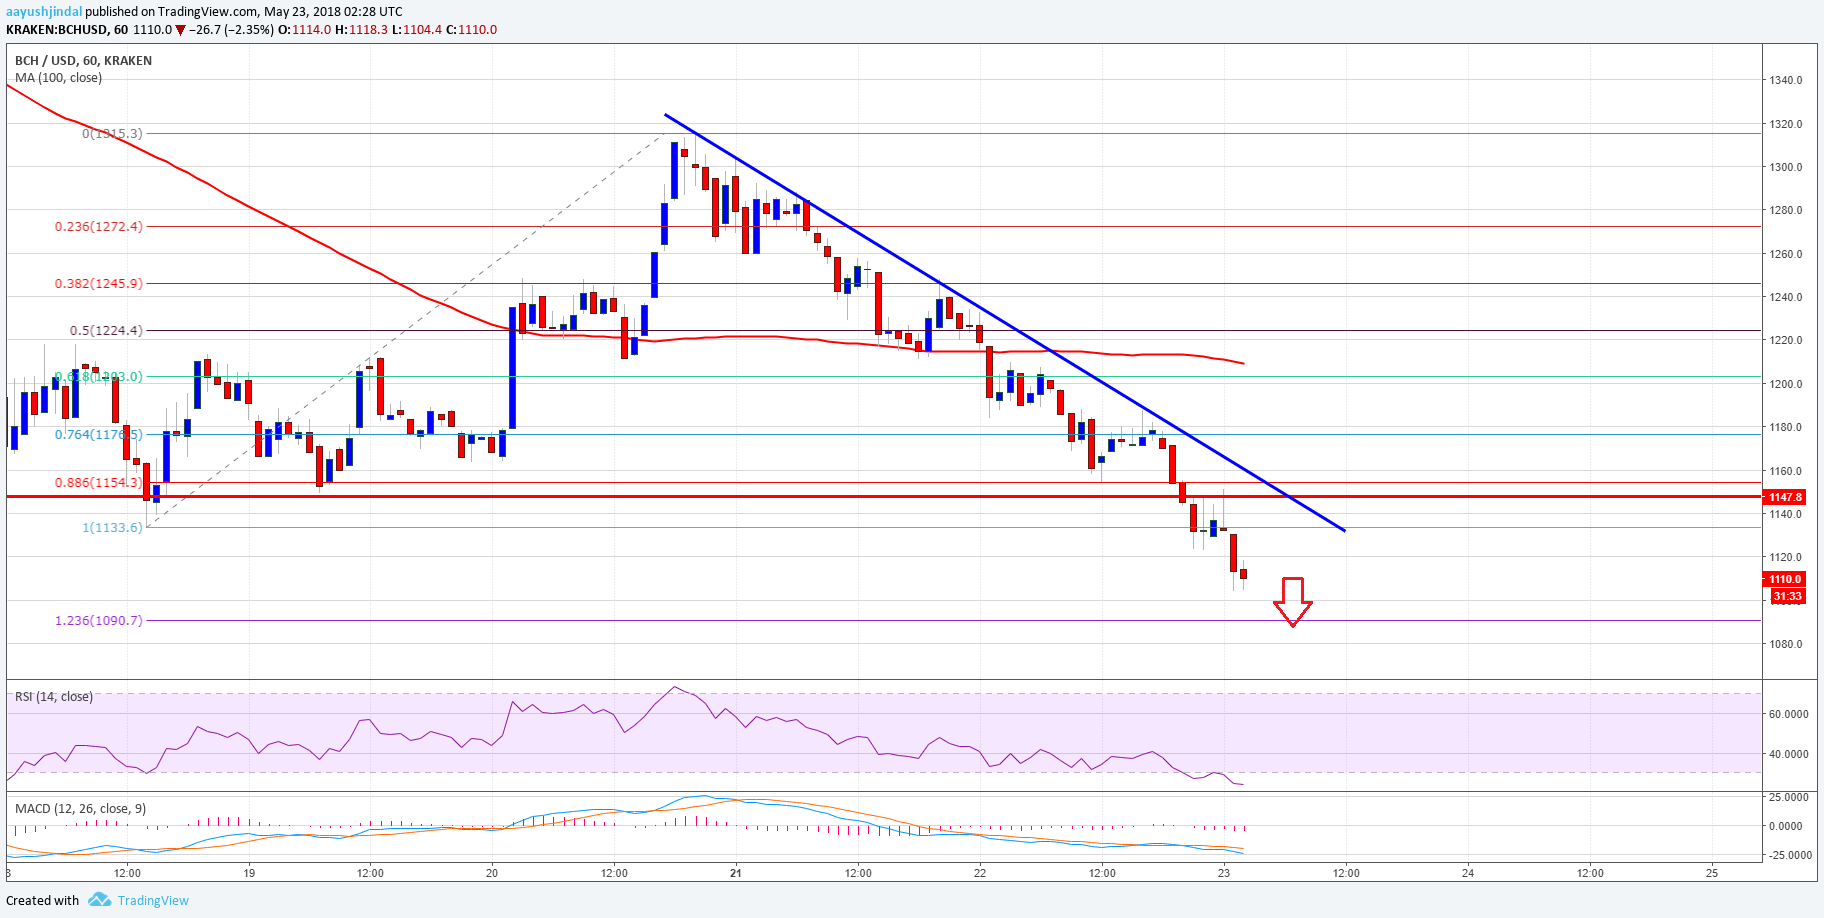
Looking at the chart, the price is clearly under a lot of bearish pressure below $1,150. However, if buyers manage to push the price above $1,150-60, it could bounce back quickly.
Looking at the technical indicators:
Hourly MACD – The MACD for BCH/USD is now in the bearish zone.
Hourly RSI (Relative Strength Index) – The RSI for BCH/USD is in the oversold area.
Major Support Level – $1,090
Major Resistance Level – $1,150


