

Key Points
- Bitcoin cash price remained below the $200 resistance and corrected lower against the US Dollar.
- There is a major bearish trend line formed with resistance near $193 on the hourly chart of the BCH/USD pair (data feed from Kraken).
- The pair could consolidate in the short term below $195 and $200 before the next move.
Bitcoin cash price remained in a range below the $200 resistance against the US Dollar. BCH/USD must climb above $190 and $200 to climb further higher in the near term.
Bitcoin Cash Price Analysis
Yesterday, we saw a rejection in bitcoin cash price near the $195-200 resistance zone against the US Dollar. The BCH/USD pair corrected lower and traded below the $180 level. It tested the $165 support area and formed a base for the next move. The price climbed higher and retested the $195-200 zone where sellers appeared. There was a fresh decline recently and the price traded towards the $170 level.
A new intraday low was formed at $172 and later the price corrected higher. It moved above the 23.6% Fib retracement level of the recent decline from the $197 high to $172 low. There was also a close above the $180 level and the 100 hourly simple moving average. However, there are many resistances on the upside near the $188 and $190 levels. There is also a major bearish trend line formed with resistance near $193 on the hourly chart of the BCH/USD pair. Below the trend line, the 61.8% Fib retracement level of the recent decline from the $197 high to $172 low is also a hurdle.
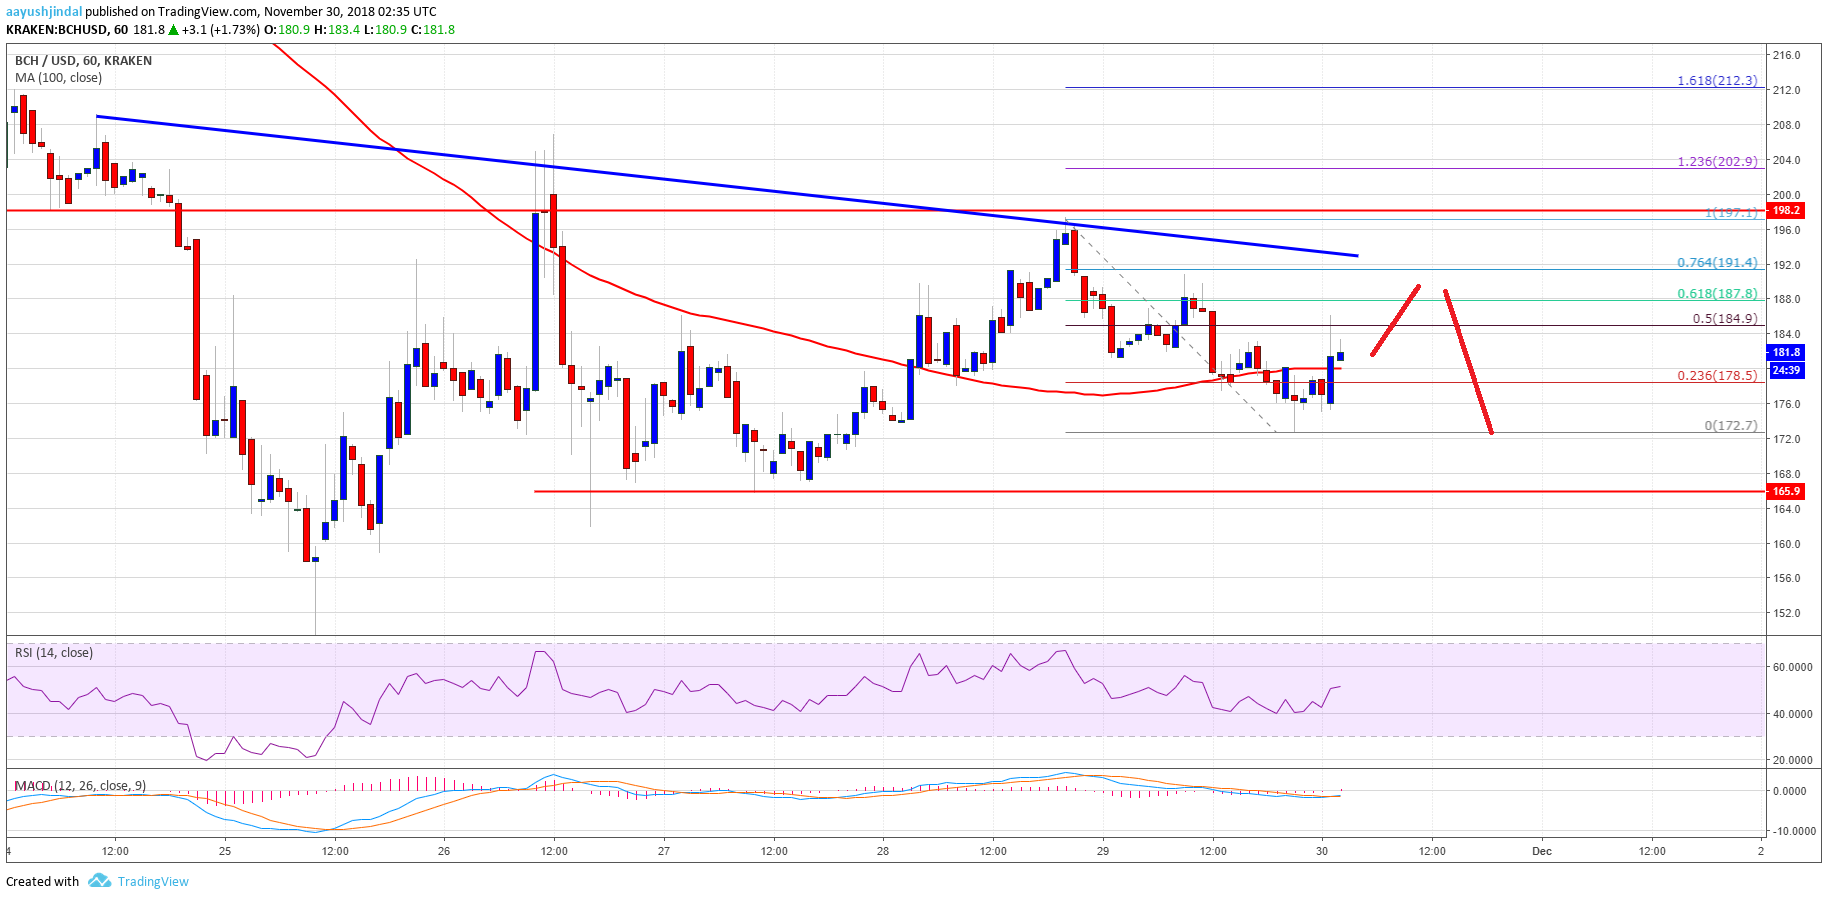

Looking at the chart, BCH price seems to be consolidating below the $200 resistance. On the downside, the key support is at $165, below which the price may test $150.
Looking at the technical indicators:
Hourly MACD – The MACD for BCH/USD is slowly moving in the bullish zone.
Hourly RSI (Relative Strength Index) – The RSI for BCH/USD is just above the 50 level.
Major Support Level – $165
Major Resistance Level – $195