
Reason to trust
How Our News is Made
Strict editorial policy that focuses on accuracy, relevance, and impartiality
Ad discliamer
Morbi pretium leo et nisl aliquam mollis. Quisque arcu lorem, ultricies quis pellentesque nec, ullamcorper eu odio.
Key Points
- Bitcoin cash price traded higher recently and moved above the $515 resistance against the US Dollar.
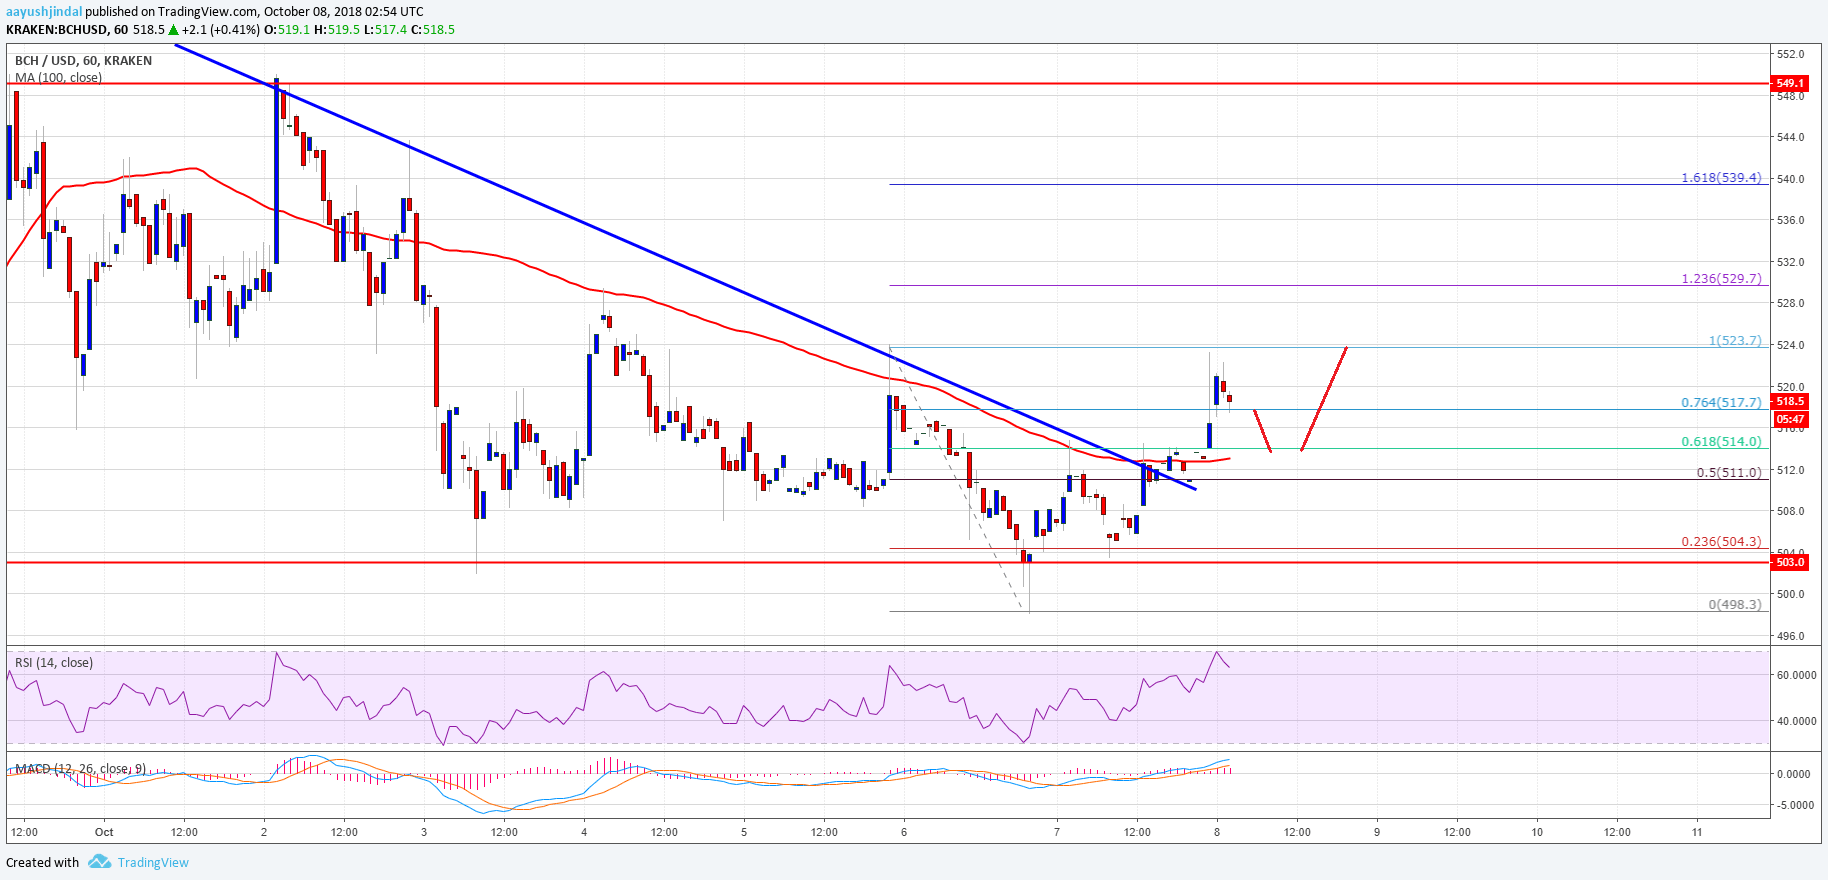
- There was a break above a crucial bearish trend line with resistance at $512 on the hourly chart of the BCH/USD pair (data feed from Kraken).
- The pair is now placed in a positive zone and it could continue to move higher towards $530 and $540.
Bitcoin cash price is slowly moving higher against the US Dollar. BCH/USD is likely to continue higher once buyers gain momentum above the $525 level.
Bitcoin Cash Price Analysis
This past week, there was a significant downside move below the $550 support in bitcoin cash price against the US Dollar. The BCH/USD pair traded below the $540 and $520 support levels. There was even a spike below the $500 level and a low was formed at $498. Later, buyers appeared and pushed the price back above the $500 level. Later, the price gained momentum and moved above the $510 and $515 resistance levels.
There was also a break above the 61.8% Fib retracement level of the last decline from the $523 high to $498 low. More importantly, there was a break above a crucial bearish trend line with resistance at $512 on the hourly chart of the BCH/USD pair. The pair is now trading nicely above the $510 level and the 100 hourly simple moving average. It traded close to the $525 resistance and is currently consolidating. On the upside, the next resistance is near $530 and the 1.236 Fib extension level of the last decline from the $523 high to $498 low. Above $530, the price could trade towards the $540 level, which is near the 1.618 Fib extension.
Looking at the chart, BCH price is now placed nicely in a positive zone above $510 and it could test $530 and $540 in the near term.
Looking at the technical indicators:
Hourly MACD – The MACD for BCH/USD is back in the bullish zone.
Hourly RSI (Relative Strength Index) – The RSI for BCH/USD is well above the 50 level.
Major Support Level – $510
Major Resistance Level – $530


