

Key Points
- Bitcoin cash price tumbled and broke the $125 and $100 support levels against the US Dollar.
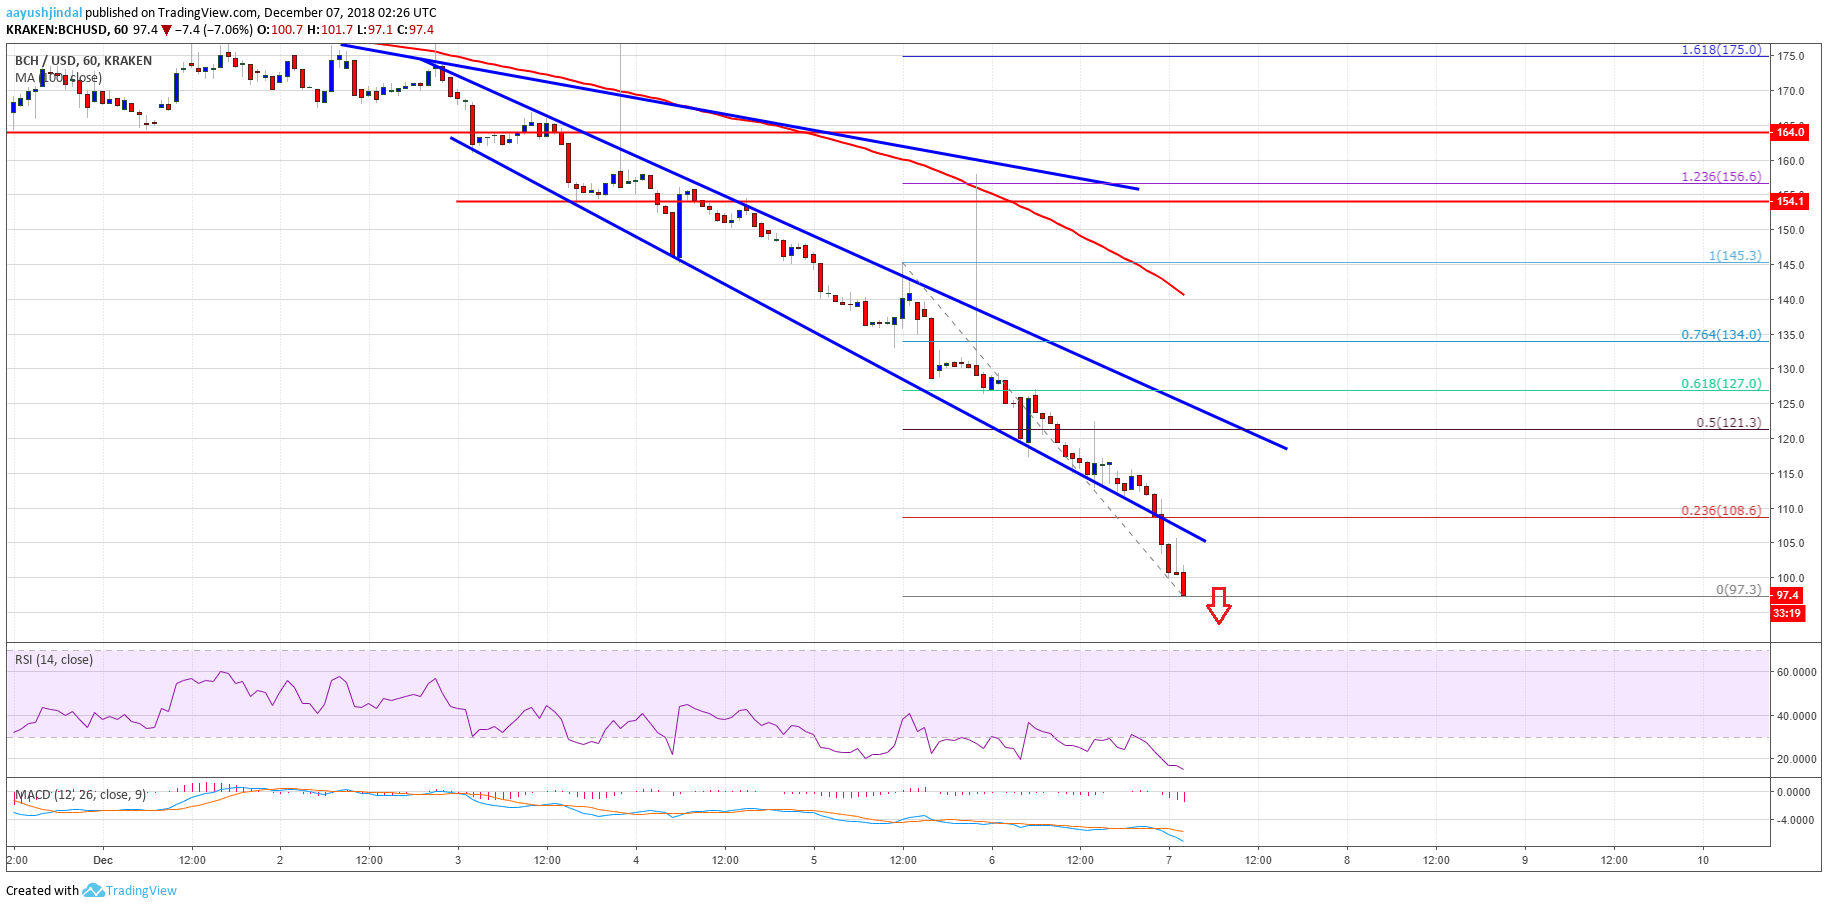
- There is a monster bearish trend line in place with resistance at $120 on the hourly chart of the BCH/USD pair (data feed from Kraken).
- The pair is currently at a risk of more losses below the $100 level in the near term.
Bitcoin cash price ABC tumbled below $100 whereas BCHSV climbed above $100 against the US Dollar. BCH/USD is under pressure and it could trade towards $80.
Bitcoin Cash Price Analysis
Yesterday, we discussed that bitcoin cash price could test the $100 support against the US Dollar. The BCH/USD pair did move down and broke the $120 and $110 support levels. The price not only tested the $100 level, but sellers succeeded in clearing $100. A new yearly low was formed near $95 and it seems like the price may continue to slide. More importantly, BCHSV climbed higher recently and surpassed the value of BCHABC, which is a negative sign.
There are many bearish signs on the chart below the $100 level. If there is a correction, the price may test the $105-108 resistance zone. It coincides with the 23.6% Fib retracement level of the recent decline from the $145 high to $97 low. However, the price is trading well below the $125 level and the 100 hourly simple moving average. Therefore, a major upward move above $110 is very unlikely. Besides, there is a monster bearish trend line in place with resistance at $120 on the hourly chart of the BCH/USD pair.

Looking at the chart, BCH price remains in a major downtrend below $120. Sellers are likely to push the price below the $90 level. The next target for them could be $80.
Looking at the technical indicators:
Hourly MACD – The MACD for BCH/USD is placed heavily in the bearish zone.
Hourly RSI (Relative Strength Index) – The RSI for BCH/USD is near oversold levels.
Major Support Level – $90
Major Resistance Level – $105