

Key Points
- Bitcoin cash price climbed higher recently and broke the $550 resistance against the US Dollar.
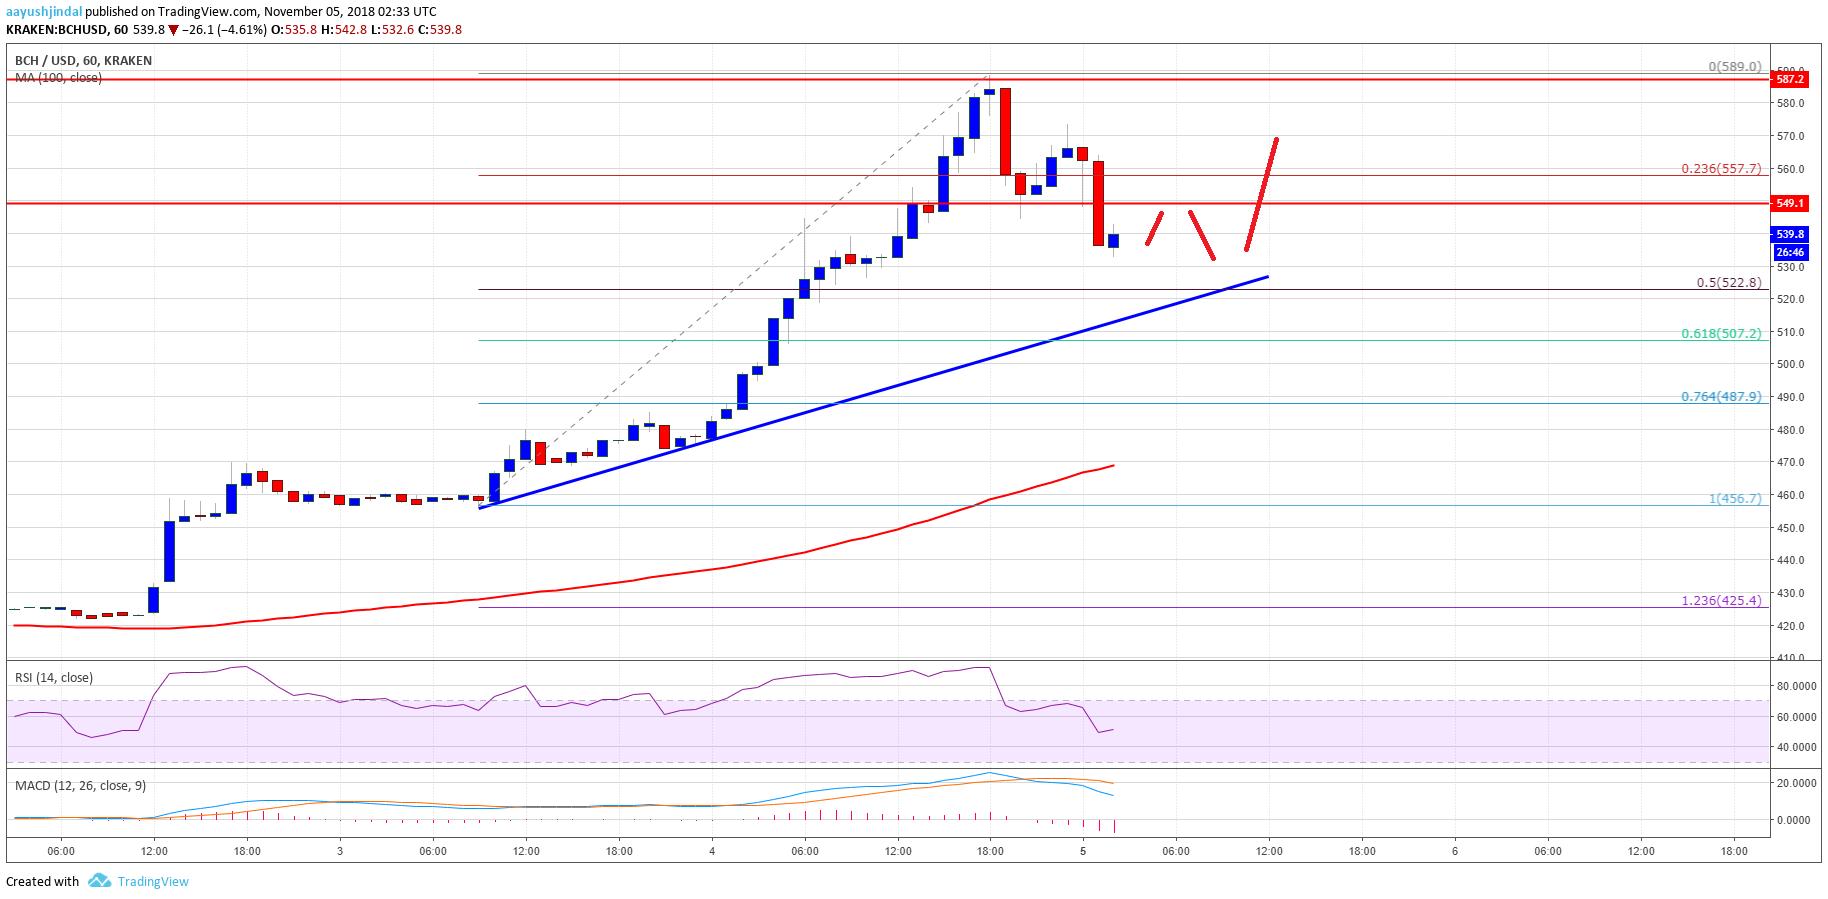
- There is a major bullish trend line formed with support at $522 on the hourly chart of the BCH/USD pair (data feed from Kraken).
- The pair could correct further lower, but it is likely to find bids near $520 in the near term.
Bitcoin cash price rallied recently above $500 against the US Dollar. BCH/USD is now in an uptrend and dips remain supported on the downside.
Bitcoin Cash Price Analysis
In the weekly analysis, we discussed the chances of bitcoin cash price surpassing the $500 barrier against the US Dollar. The BCH/USD pair did trade higher and broke many resistances near the $550 level. It traded close to the $600 level and formed a high at $589. Later, the price started a downside correction and declined below $560. There was a break below the 23.6% Fib retracement level of the recent wave from the $456 low to $489 high.
However, there are many supports on the downside near $520. More importantly, there is a major bullish trend line formed with support at $522 on the hourly chart of the BCH/USD pair. The trend line is close to the 50% Fib retracement level of the recent wave from the $456 low to $489 high. Therefore, if the pair continues to move down, it is likely to find bids near $520 in the near term. If there is a break below the $520 zone, the next support is near the $500 handle.

Looking at the chart, BCH price is clearly placed in an uptrend above the $500 handle. In the short term, there could be corrective moves before the next rally above $560 and $580.
Looking at the technical indicators:
Hourly MACD – The MACD for BCH/USD moved back in the bearish zone.
Hourly RSI (Relative Strength Index) – The RSI for BCH/USD is just near the 50 level.
Major Support Level – $520
Major Resistance Level – $580