
Key Points
- Bitcoin cash price failed to move past the $900-910 resistance and declined sharply against the US Dollar.
- Yesterday’s highlighted key bullish trend line was breached at $880 on the hourly chart of the BCH/USD pair (data feed from Kraken).
- The pair is currently under a bearish pressure and it could soon retest the $825 support.
Bitcoin cash price struggled to trade above $910 against the US Dollar. BCH/USD declined and it may perhaps continue to move down towards the $825 support.
Bitcoin Cash Price Decline
There were many attempts to break the $900-910 resistance zone by bitcoin cash price against the US Dollar. The price failed to settle above $910, which resulted in a sharp downside move. It declined and broke many supports, including $900 and $880. BCH price even settled below the $875 level and the 100 hourly simple moving average to move into a bearish zone.
More importantly, yesterday’s highlighted key bullish trend line was breached at $880 on the hourly chart of the BCH/USD pair. The pair even broke the 50% Fib retracement level of the last wave from the $824 low to $926 high. Therefore, there are chances of more losses below the $850 level in the near term. At the moment, the price is consolidating near the 76.4% Fib retracement level of the last wave from the $824 low to $926 high. However, the price may perhaps continue to move down and it could soon retest the $825 swing low. Below this, the price may even revisit the $800 support zone.
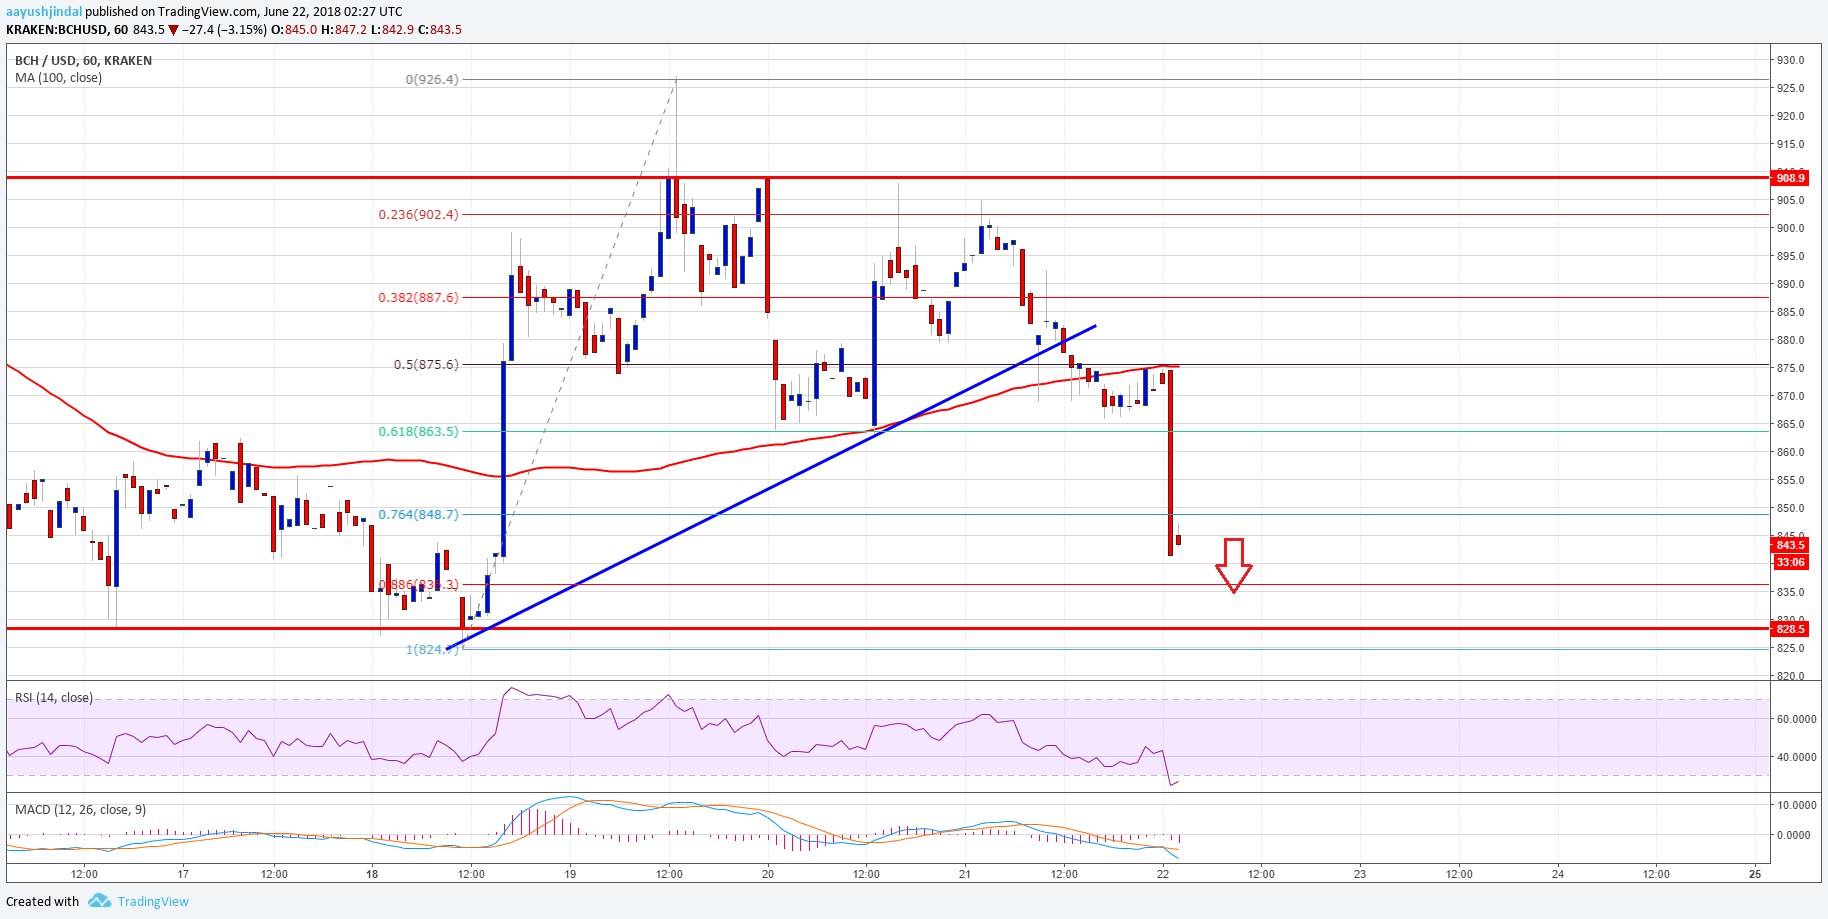

Looking at the chart, the price is clearly under bearish pressure below $880. To initiate a recovery, it has to move above the $880 barrier and the 100 hourly SMA.
Looking at the technical indicators:
Hourly MACD – The MACD for BCH/USD has moved back in the bearish zone.
Hourly RSI (Relative Strength Index) – The RSI for BCH/USD has reached the oversold levels with bearish signs.
Major Support Level – $825
Major Resistance Level – $880