

Key Points
- Bitcoin cash price declined recently and broke the $575-580 support against the US Dollar.
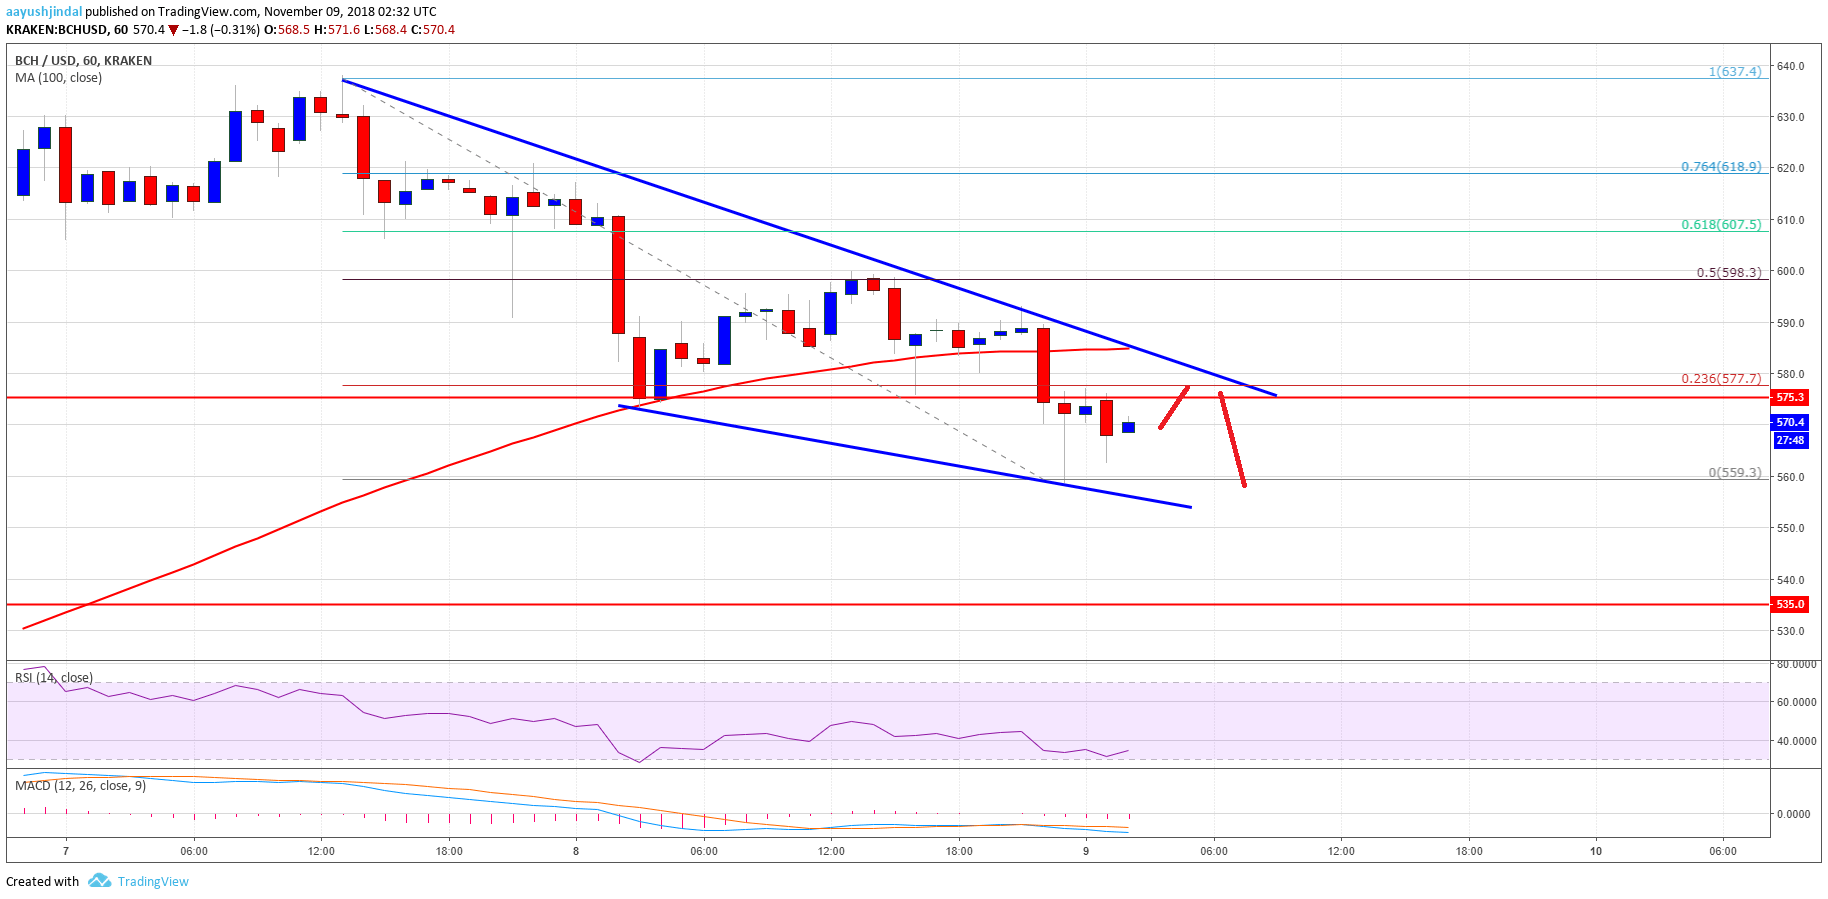
- There is a major bearish trend line in place with resistance at $582 on the hourly chart of the BCH/USD pair (data feed from Kraken).
- The pair may continue to slide and it could even test the $550 support level in the near term.
Bitcoin cash price extended declines below $600 against the US Dollar. BCH/USD is currently under pressure and it looks set to test the $550 support.
Bitcoin Cash Price Analysis
Yesterday, we saw an extended downside correction below the $600-605 support in bitcoin cash price against the US Dollar. The BCH/USD pair traded below the $575-580 support area to move into a short term bearish zone. Moreover, there was a close below the $600 level and the 100 hourly simple moving average. During the decline, the price even surpassed the 61.8% Fib retracement level of the last wave from the $533 low to $638 swing high.
The price recently tested the $560 support and it is currently consolidating losses. An initial resistance is near the 23.6% Fib retracement level of the recent decline from the $638 high to $559 low. Besides, there is a major bearish trend line in place with resistance at $582 on the hourly chart of the BCH/USD pair. Buyers need to push the price above the trend line and the $580 resistance to resume uptrend. Above the trend line, the 100 hourly SMA is near $590 to act as a resistance.

Looking at the chart, BCH price is currently under pressure below the $600 level and the 100 hourly simple moving average. As long as there is no close above $600, there are chances of more slides towards the $550 support level.
Looking at the technical indicators:
Hourly MACD – The MACD for BCH/USD is placed heavily in the bearish zone.
Hourly RSI (Relative Strength Index) – The RSI for BCH/USD is now well below the 40 level.
Major Support Level – $550
Major Resistance Level – $590