

Key Points
- Bitcoin cash price declined toward the $900 support recently against the US Dollar.
- There is a key bearish trend line forming with resistance at $990 on the hourly chart of the BCH/USD pair (data feed from Kraken).
- The pair is currently correcting higher, but it is likely to find sellers near $990-$1,000.
Bitcoin cash price declined heavily below $1,000 against the US Dollar. BCH/USD might correct a few points toward the previous support levels in the near term.
Bitcoin Cash Price Trend
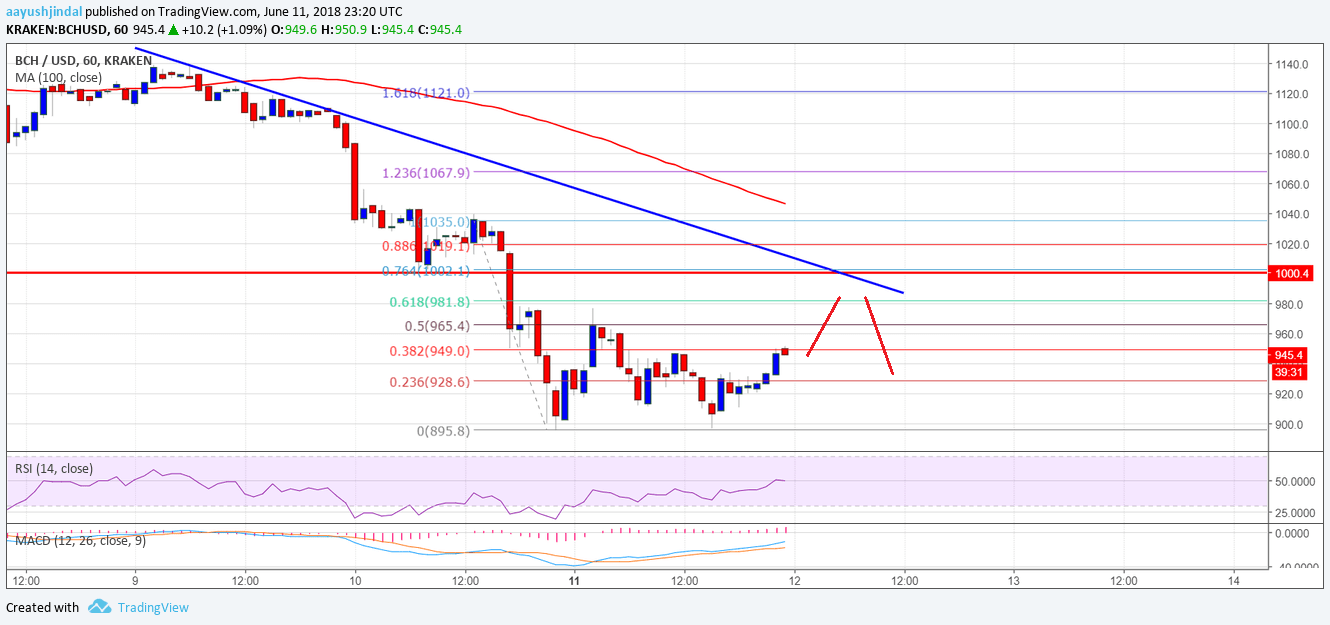
There was a sharp downside move from the $1,200 resistance in bitcoin cash price against the US Dollar. The price declined and broke many supports such as $1,100 and $1,050. More importantly, there was a break and close below the $1,000 level. It traded close to the $900 support level where buyers emerged. A low was formed near $895 and the price started an upside correction.
It is currently trading above the 23.6% fib retracement level of the last decline from the $1,035 swing high to the $895 low. However, there are many hurdles on the upside waiting near the $950 and $990 levels. There is also a key bearish trend line forming with resistance at $990 on the hourly chart of the BCH/USD pair. Moreover, the 50% fib retracement level of the last decline from the $1,035 swing high to the $895 low is near $965 to prevent upsides. Therefore, if the price corrects higher, it is likely to find sellers on the upside near $950 and $990.

Looking at the chart, the pair is in a downtrend and the current recovery may face sellers below $1,000. On the downside, supports are seen near the $920 ad $900 levels, followed by $850.
Looking at the technical indicators:
Hourly MACD – The MACD for BCH/USD is slowly recovering toward the bullish zone.
Hourly RSI (Relative Strength Index) – The RSI for BCH/USD is about to move above the 50 level.
Major Support Level – $900
Major Resistance Level – $990