

Key Points
- Bitcoin cash price moved a few points above $700, but it failed to gain momentum against the US Dollar.
- This week’s highlighted important bearish trend line was broken with resistance at $708 on the hourly chart of the BCH/USD pair (data feed from Kraken).
- The pair failed to gain traction and it could move back below $700 in the near term.
Bitcoin cash price failed to recover above $720 against the US Dollar. BCH/USD may perhaps resume its slide for more losses below $700.
Bitcoin Cash Price Support
Yesterday, there was a minor upside move initiated from the $688 swing low in bitcoin cash price against the US Dollar. The BCH/USD pair tested the 76.4% Fib retracement level of the last wave from the $664 low to $780 high. Later, it started an upside move and traded above the $700 level. More importantly, this week’s highlighted important bearish trend line was broken with resistance at $708 on the hourly chart of the BCH/USD pair.
However, the price failed to gain momentum after it broke the trend line and $700. It also faced a strong resistance near the 38.2% Fib retracement level of the last drop from the $780 high to $688 low. Lastly, the 100 hourly simple moving average and the $720 resistance also stopped gains. The price is once again under pressure and it may perhaps break the $700 level. On the downside, supports are seen near the $688 and $665 levels.
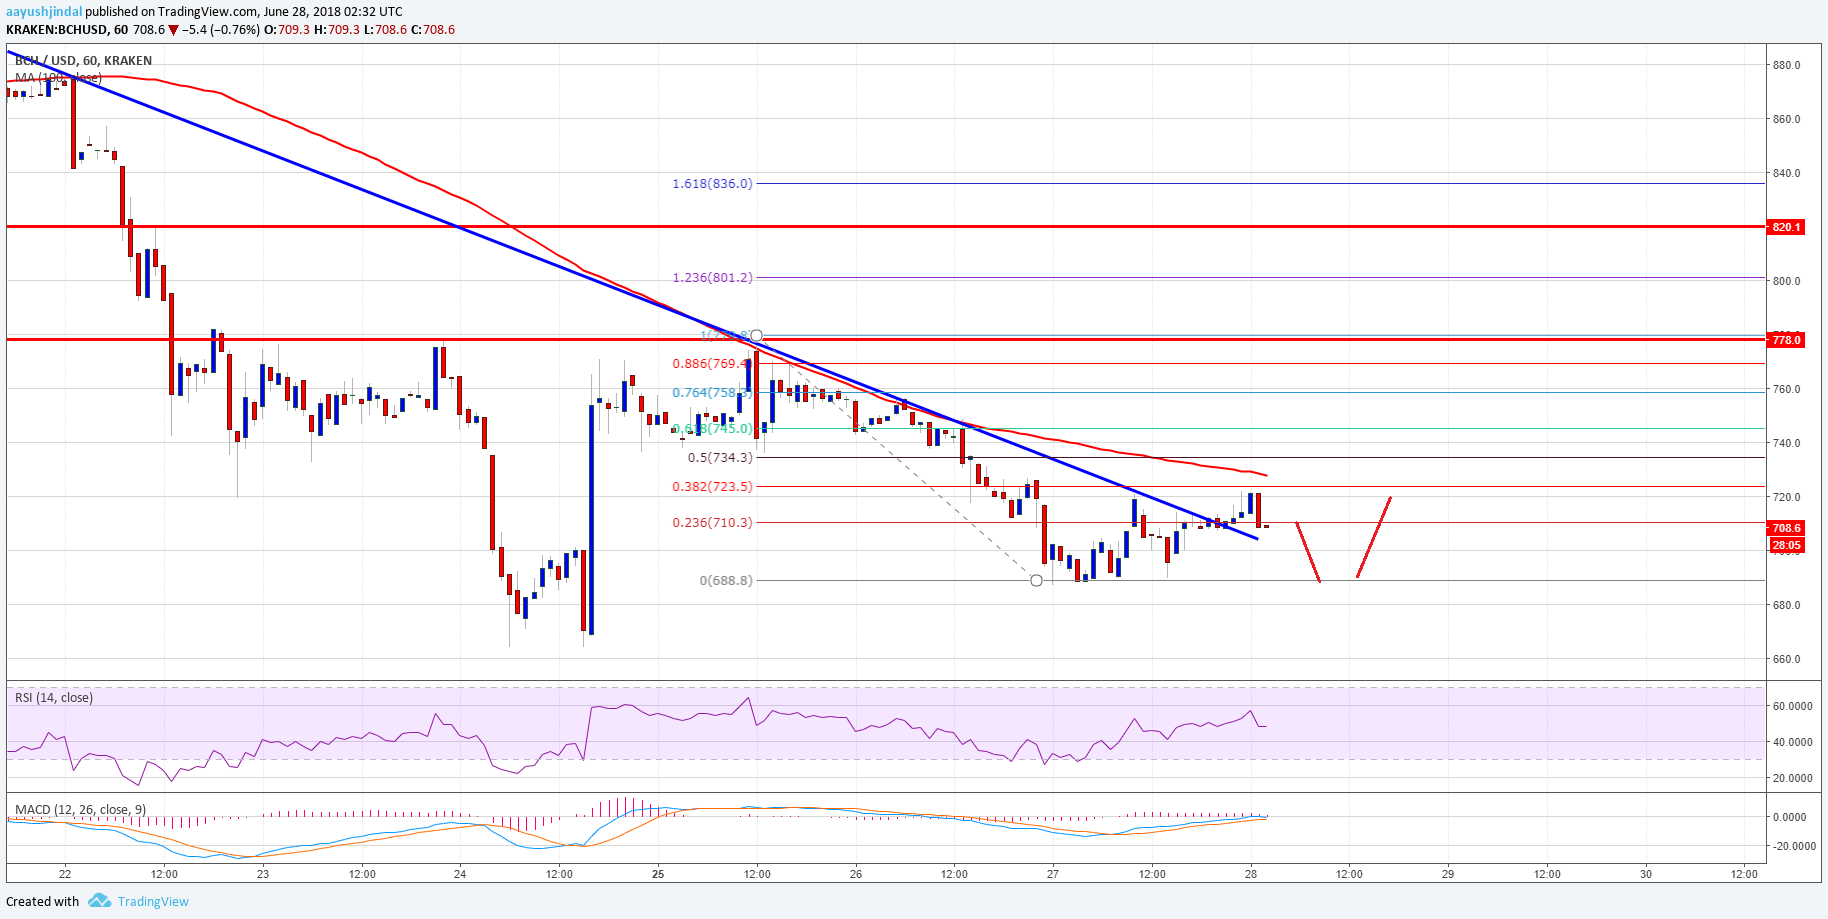

Looking at the chart, the price has to move above the $720 resistance and the 100 hourly SMA. The 50% Fib retracement level of the last drop from the $780 high to $688 low is also at $734 to prevent gains. A successful close above $735-740 is needed for buyers to take control.
Looking at the technical indicators:
Hourly MACD – The MACD for BCH/USD is slightly in the bullish zone.
Hourly RSI (Relative Strength Index) – The RSI for BCH/USD is now placed above the 50 level.
Major Support Level – $688
Major Resistance Level – $735