

Key Points
- Bitcoin cash price failed to move above the $900 resistance zone and declined against the US Dollar.
- There is a short-term connecting bullish trend line formed with support at $865 on the hourly chart of the BCH/USD pair (data feed from Kraken).
- The pair must stay above $860 and the 100 hourly simple moving average to avoid more losses.
Bitcoin cash price failed to surpass a major hurdle near $900 against the US Dollar. BCH/USD declined and is currently testing the 100 hourly SMA.
Bitcoin Cash Price Resistance
Yesterday, we saw a decent upside move in bitcoin cash price above the $880 level against the US Dollar. The price traded towards the $900-910 resistance zone where sellers appeared. It failed to move above $910 and started a downside move. There was a major bearish reaction and the price declined below the $880 level. Moreover, there was also a break below the 50% Fib retracement level of the last wave from the $826 low to $927 high.
At the moment, the price is approaching a key support area above $860. There is also a short-term connecting bullish trend line formed with support at $865 on the hourly chart of the BCH/USD pair. The same trend line is positioned around the 61.8% Fib retracement level of the last wave from the $826 low to $927 high. Moreover, the 100 hourly simple moving average is positioned around the $860 level. Therefore, the $860-865 support zone holds a lot of importance.
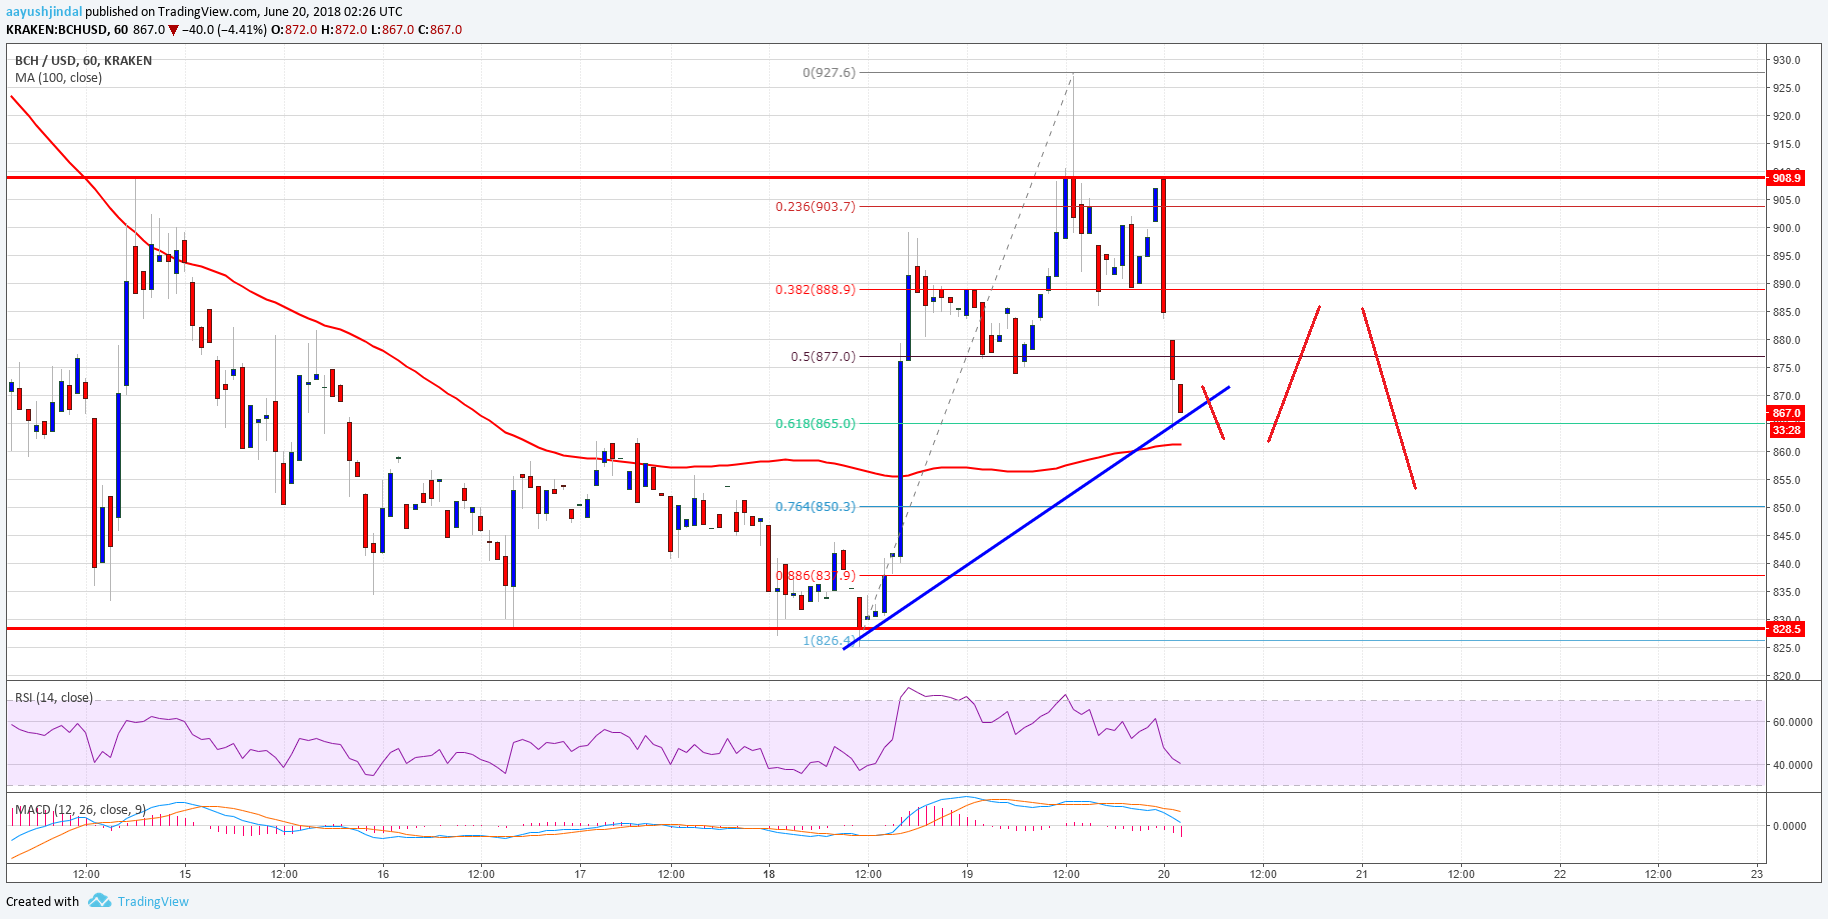

Looking at the chart, the pair must stay above $860 and the 100 hourly simple moving average. If not, there are chances of more declines below the $850 level in the near term. On the upside, resistances are seen near $880 and $900 levels.
Looking at the technical indicators:
Hourly MACD – The MACD for BCH/USD is now back in the bearish zone.
Hourly RSI (Relative Strength Index) – The RSI for BCH/USD dipped sharply below the 50 level.
Major Support Level – $860
Major Resistance Level – $900