

Key Points
- Bitcoin cash price failed to move past the $1770 resistance and moved down against the US Dollar.
- There was a break below a major bullish trend line with support $1680 on the hourly chart of BCH/USD (data feed from Kraken).
- The pair is now moving lower and it is likely to extend declines toward the $1550 support area.
Bitcoin cash price is struggling to gain traction above $1750 against the US Dollar. BCH/USD is now back in the bearish zone and is currently moving down toward $1550.
Bitcoin Cash Price Resistance
After a decent upside move above $1750, bitcoin cash price faced sellers against the US Dollar. The price started a downside move and traded below the $1700 support level to initiate a downtrend. There was a break below 23.6% Fib retracement level of the last wave from the $1468 low to $1772 high. More importantly, there was a break below a major bullish trend line with support $1680 on the hourly chart of BCH/USD.
The pair is currently under a lot of pressure below $1650 and the 100 hourly simple moving average. It is now below the 50% Fib retracement level of the last wave from the $1468 low to $1772 high. This is a strong bearish sign and is means the price may accelerate lower towards $1550. The mentioned $1550 support is important in the short term since it was a resistance earlier. An intermediate support is the 61.8% Fib retracement level of the last wave from the $1468 low to $1772 high at $1584.
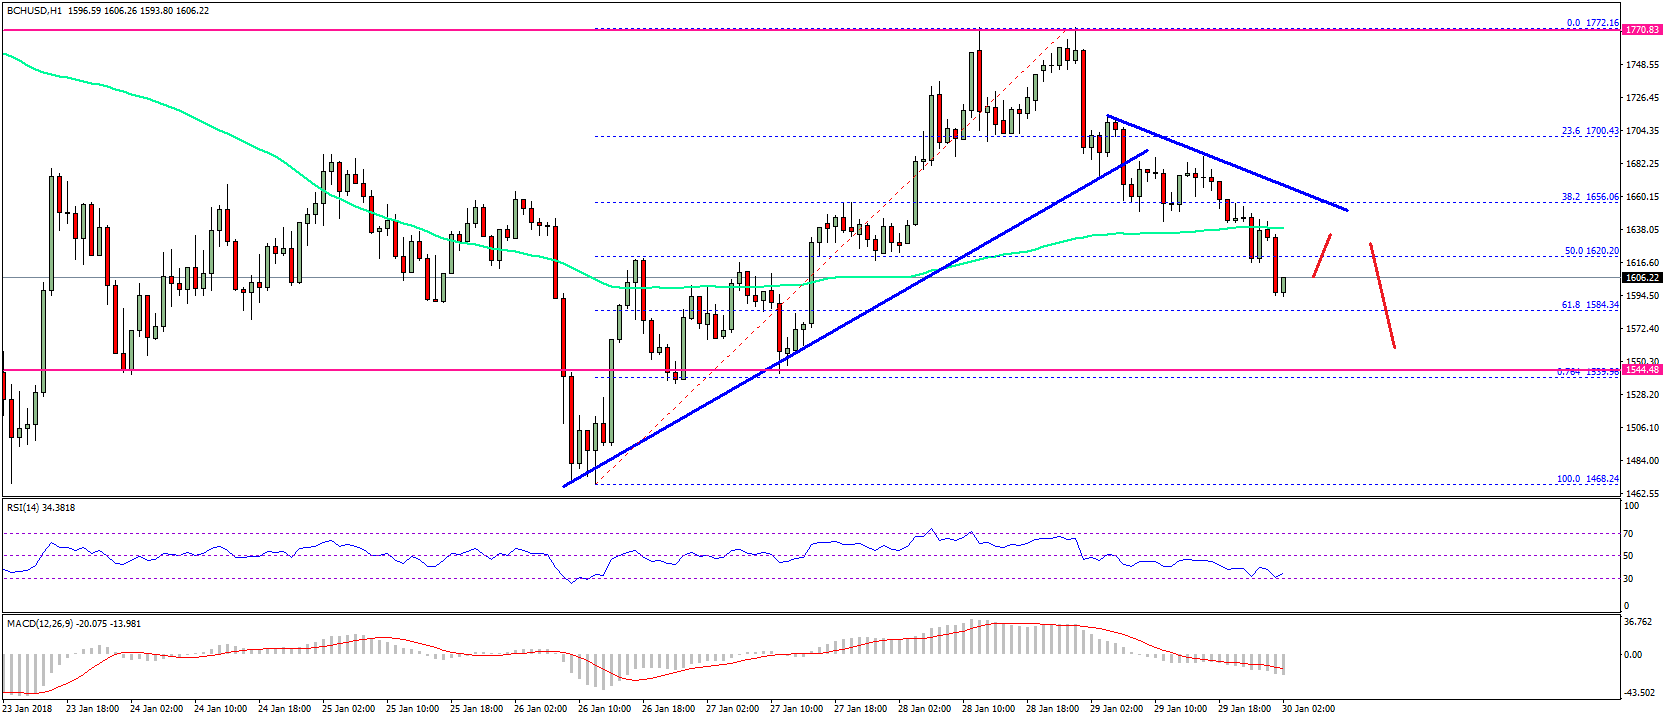

On the upside, there is a bearish trend line forming with resistance at $1650. As long as the price is below $1650, it could continue to move down.
Looking at the technical indicators:
Hourly MACD – The MACD for BCH/USD is now back in the bearish zone.
Hourly RSI (Relative Strength Index) – The RSI for BCH/USD is moving lower and it has reached the 30 level.
Major Support Level – $1550
Major Resistance Level – $1650
Charts courtesy – SimpleFX