

Key Points
- Bitcoin cash price struggled to move above the $1,500 resistance and moved down against the US Dollar.
- There was a break below a key bullish trend line with support at $1,400 on the hourly chart of the BCH/USD pair (data feed from Kraken).
- The pair declined and tested another crucial support near the $1,240 level.
Bitcoin cash price declined sharply below $1,300 against the US Dollar. BCH/USD must stay above the $1,240 support to avoid further downsides.
Bitcoin Cash Price Resistance
There was an attempt to break $1,500, but bitcoin cash price failed and moved down against the US Dollar. The price started a fresh downside move and declined below the $1,420 support level. There was also a break below the 61.8% Fib retracement level of the last wave from the $1,235 low to $1,481 high. It opened the doors for more losses and the price settled below $1,400 and the 100 hourly simple moving average.
More importantly, there was a break below a key bullish trend line with support at $1,400 on the hourly chart of the BCH/USD pair. The pair traded towards the last swing low and a crucial support at $1,240. Buyers appeared and the price started consolidating losses above $1,240. An initial resistance on the upside is near the 23.6% Fib retracement level of the last decline from the $1,481 high to $1,240 low. However, the previous support near $1,400 may perhaps act as a strong resistance on the upside.
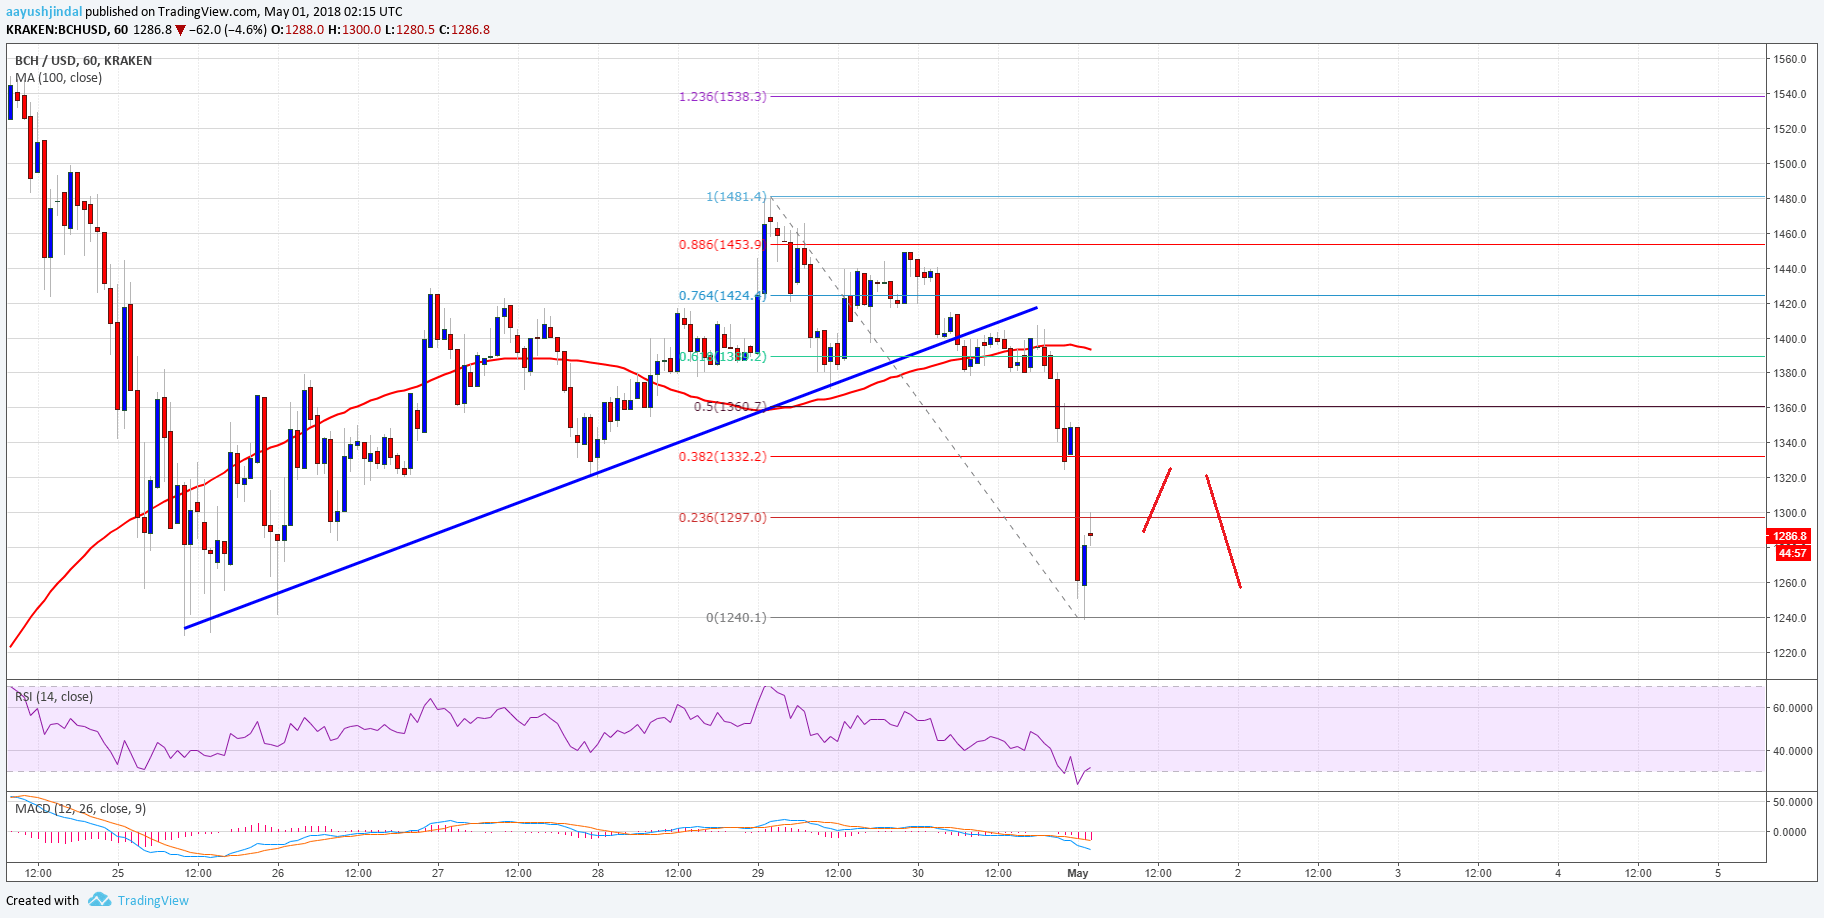

Looking at the chart, the 100 hourly simple moving average is positioned at $1,405 to act as a barrier for buyers. On the downside, the $1,240 support holds a lot of importance. BCH should stay above $1,240 to avoid further losses in the short term.
Looking at the technical indicators:
Hourly MACD – The MACD for BCH/USD is now back in the bearish zone.
Hourly RSI (Relative Strength Index) – The RSI for BCH/USD has reached the oversold levels.
Major Support Level – $1,240
Major Resistance Level – $1,400