Key Points
- Bitcoin cash price after a nice upside move found sellers near the $1,600 level against the US Dollar.
- There was a break below a short-term bullish trend line with support at $1,520 on the hourly chart of BCH/USD (data feed from SimpleFX).
- The pair is currently holding the $1,400 support, but it may remain under pressure for some time.
Bitcoin cash price lost momentum above $1,600 against the US Dollar. BCH/USD is currently correcting lower and is showing a few bearish signs.
Bitcoin Cash Price Resistance
There were decent gains this past week above $1,500 in bitcoin cash price against the US Dollar. The price traded above the $1,550 and $1,600 levels. However, the price was not able to maintain momentum above $1,600 and started a downside move. A high was formed at $1,617 and later the price corrected below $1,550. It also moved below the $1,400 support and the 100 hourly simple moving average.
Moreover, there was a break below a short-term bullish trend line with support at $1,520 on the hourly chart of BCH/USD. Later, the pair recovered and moved above the $1,400 level and the 100 hourly SMA. It corrected above the 23.6% Fib retracement level of the last decline from the $1,617 high to $1,381 low. However, the upside move failed near the $1,500 level. BCH price could not move above the $1,500 level and is currently trading in a bearish zone.
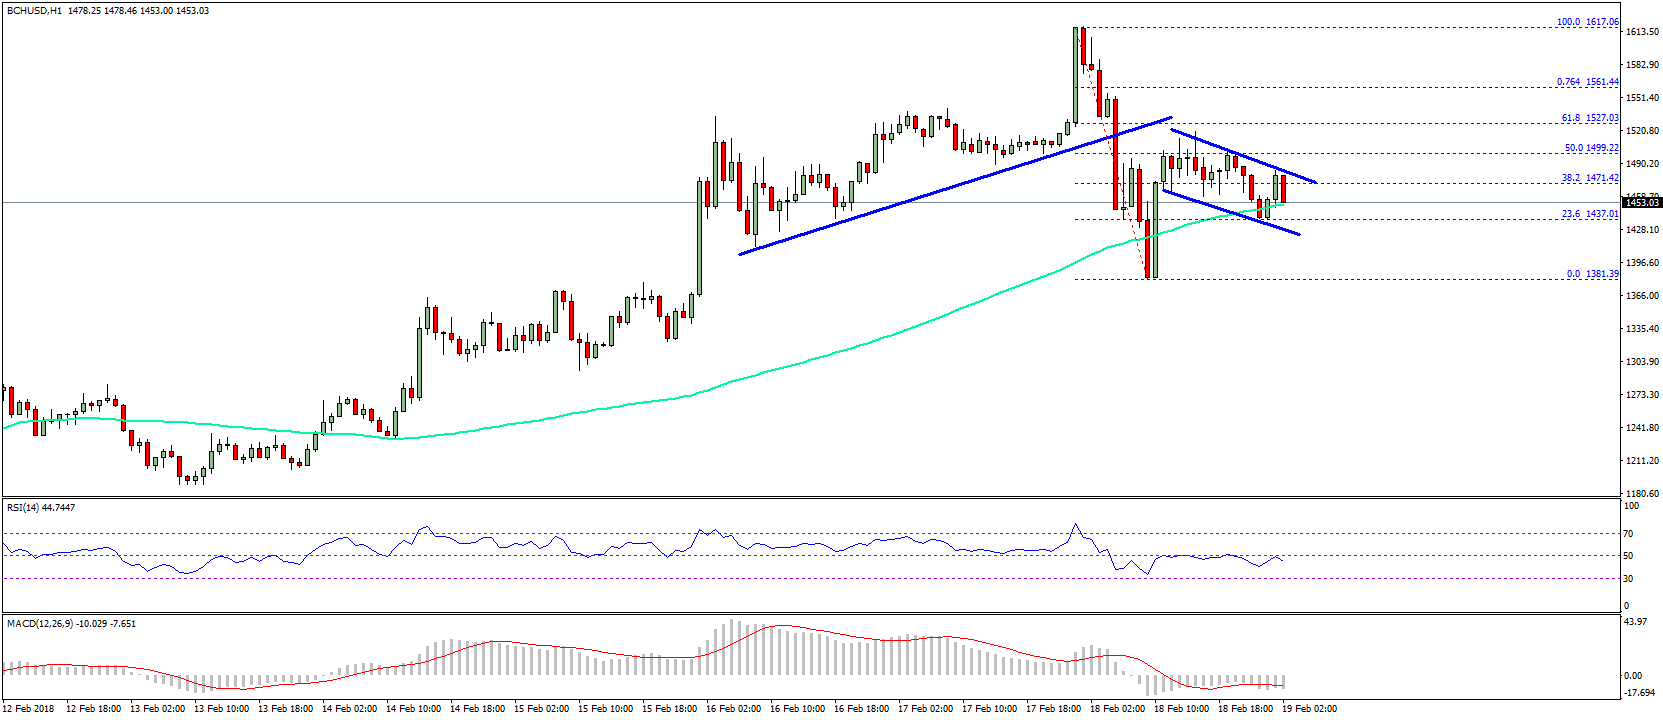

The 50% Fib retracement level of the last decline from the $1,617 high to $1,381 low was tested recently. It means the price completed an upside correction and it may decline once again towards or below $1,400. Below $1,400, the price mat decline towards $1,320.
Looking at the technical indicators:
Hourly MACD – The MACD for BCH/USD is currently in the bearish zone.
Hourly RSI (Relative Strength Index) – The RSI for BCH/USD has moved below the 50 level and is showing bearish signs.
Major Support Level – $1,400
Major Resistance Level – $1,500
Charts courtesy – SimpleFX