Key Points
- Bitcoin cash price declined sharply and broke a major support area near $1,450 against the US Dollar.
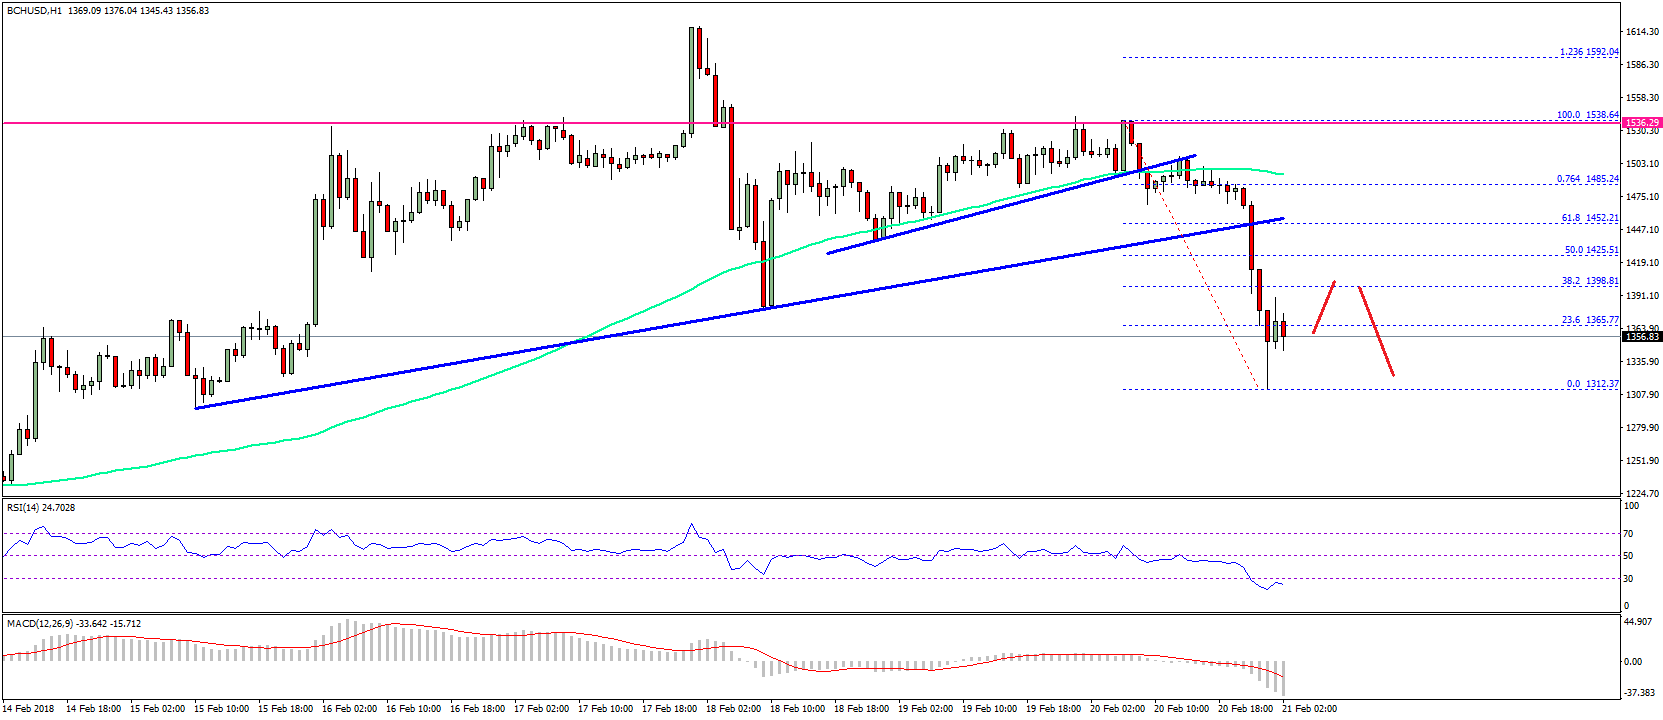
- There was a break below two bullish trend lines at $1,505 and $1,450 on the hourly chart of BCH/USD (data feed from SimpleFX).
- The pair traded as low as $1,312 and it is currently correcting higher.
Bitcoin cash price has moved back into the bearish zone against the US Dollar. BCH/USD is likely to face sellers on the upside near $1,450 and $1,500.
Bitcoin Cash Price Resistance
There were no further gains in bitcoin cash price above the $1,600 level against the US Dollar. The price started a downside move from well above $1,550 and broke many important support levels. It even traded below the $1,500 support and settled below the 100 hourly simple moving average. The decline looks real below $1,500 and it seems like the price has moved back into the bearish zone.
During the downside move, there was a break below two bullish trend lines at $1,505 and $1,450 on the hourly chart of BCH/USD. The pair even broke the $1,400 level and traded close to $1,300. A low was formed near $1,312 before the price started an upside correction. It traded a few points above the 23.6% Fib retracement level of the last decline from the $1.538 high to $1,312 low. However, it seems like the price is struggling to correct further above $1,400 and it could decline once again.

On the downside, the recent low of $1,312 is a short-term support. Once there is a close below $1,312 and $1,300, there could be further declines. On the upside, the $1,400 and $1,450 levels are important resistances.
Looking at the technical indicators:
Hourly MACD – The MACD for BCH/USD is gaining pace in the bearish zone.
Hourly RSI (Relative Strength Index) – The RSI for BCH/USD has reached the oversold levels with bearish signs.
Major Support Level – $1,300
Major Resistance Level – $1,450
Charts courtesy – SimpleFX